
Rebasing is an important technique in the investment industry for comparing values over time. Instead of showing absolute pricing (the actual price of a fund or share), it instead shows the percentage change of a fund or share over time. Because funds or shares will likely not start at the same price-point, rebasing is required to adjust the value of a share/fund as well as its comparator so that they start with the same value and thus their percentage change in value can be compared more easily.
The calculation for this is:
Rpt = P /P0 X 100
Where:
- Rpt = Rebased Price at time t
- P = Price at day t
- P0 = Price at rebase date
It is not necessary to remember this formula as rebasing is calculated automatically inside the app.
Rebasing
After creating your line chart, rebasing can be added to the app setup.
Note: For the purposes of this example, the Returns data will be used.
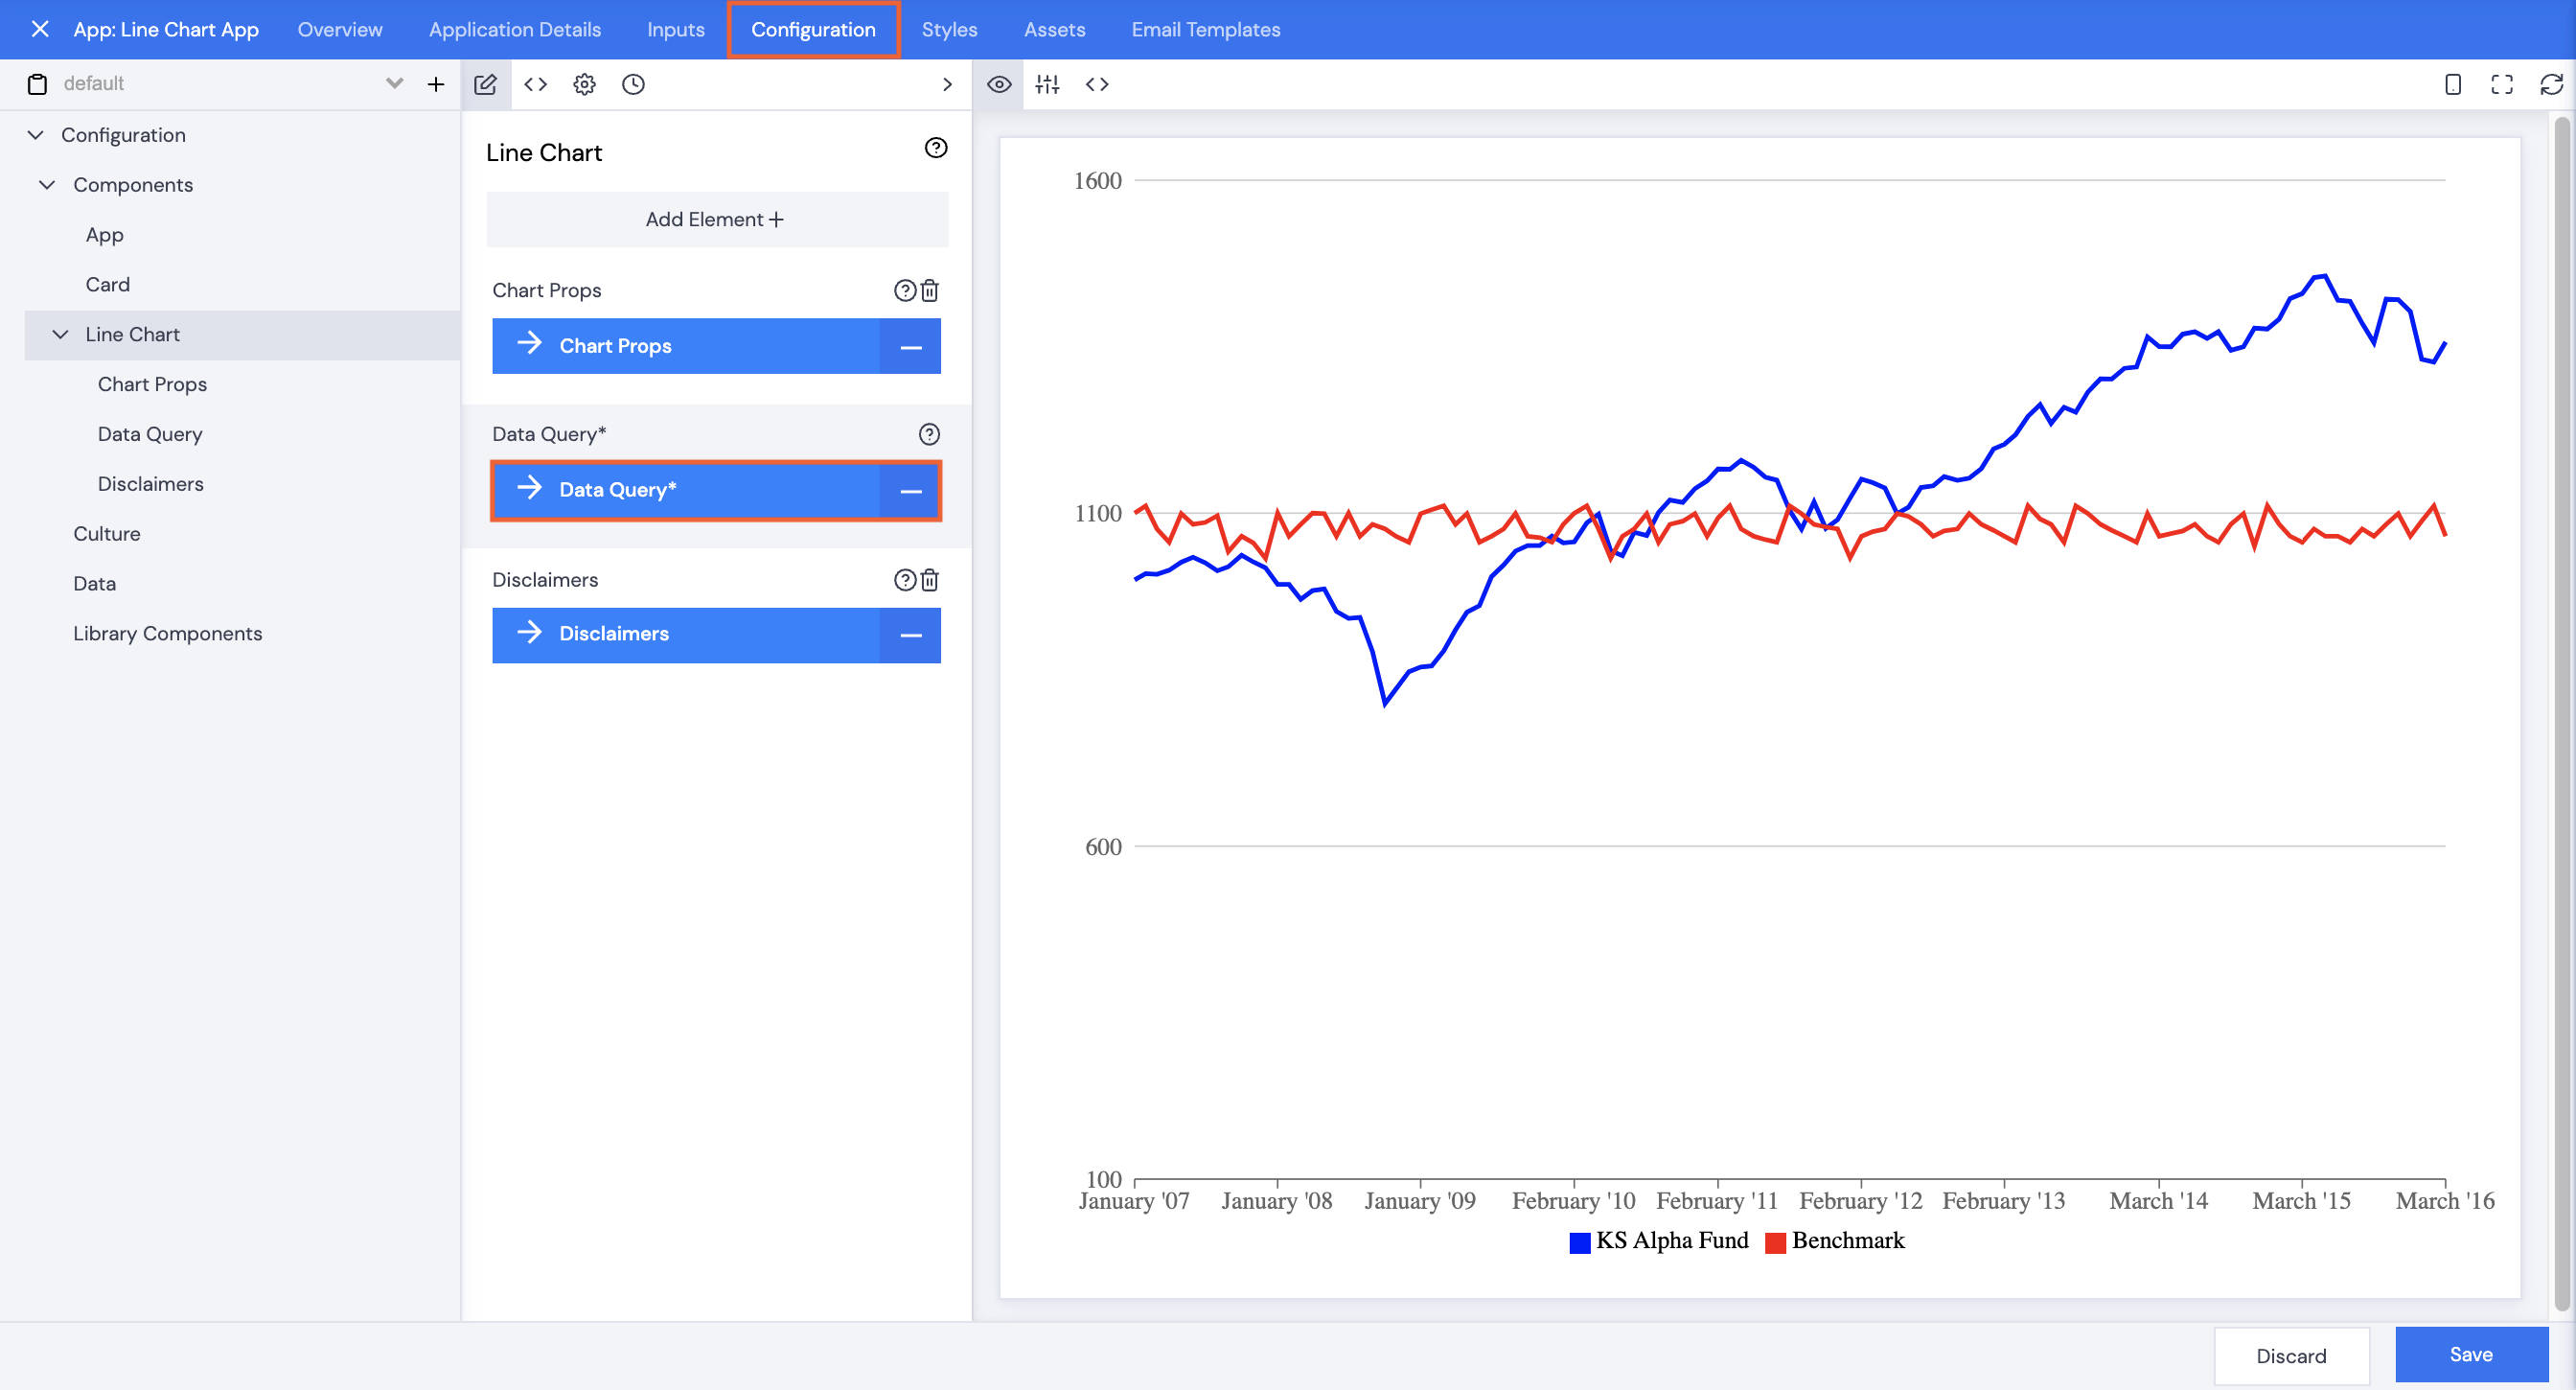
- With the Configuration tab selected, browse to Components | Line Chart.
- Click Data Query.
- Under Code: replace the current value with returns. The line chart will update immediately.
Note: If you do not have a Returns table in your data, use any Timeseries property.
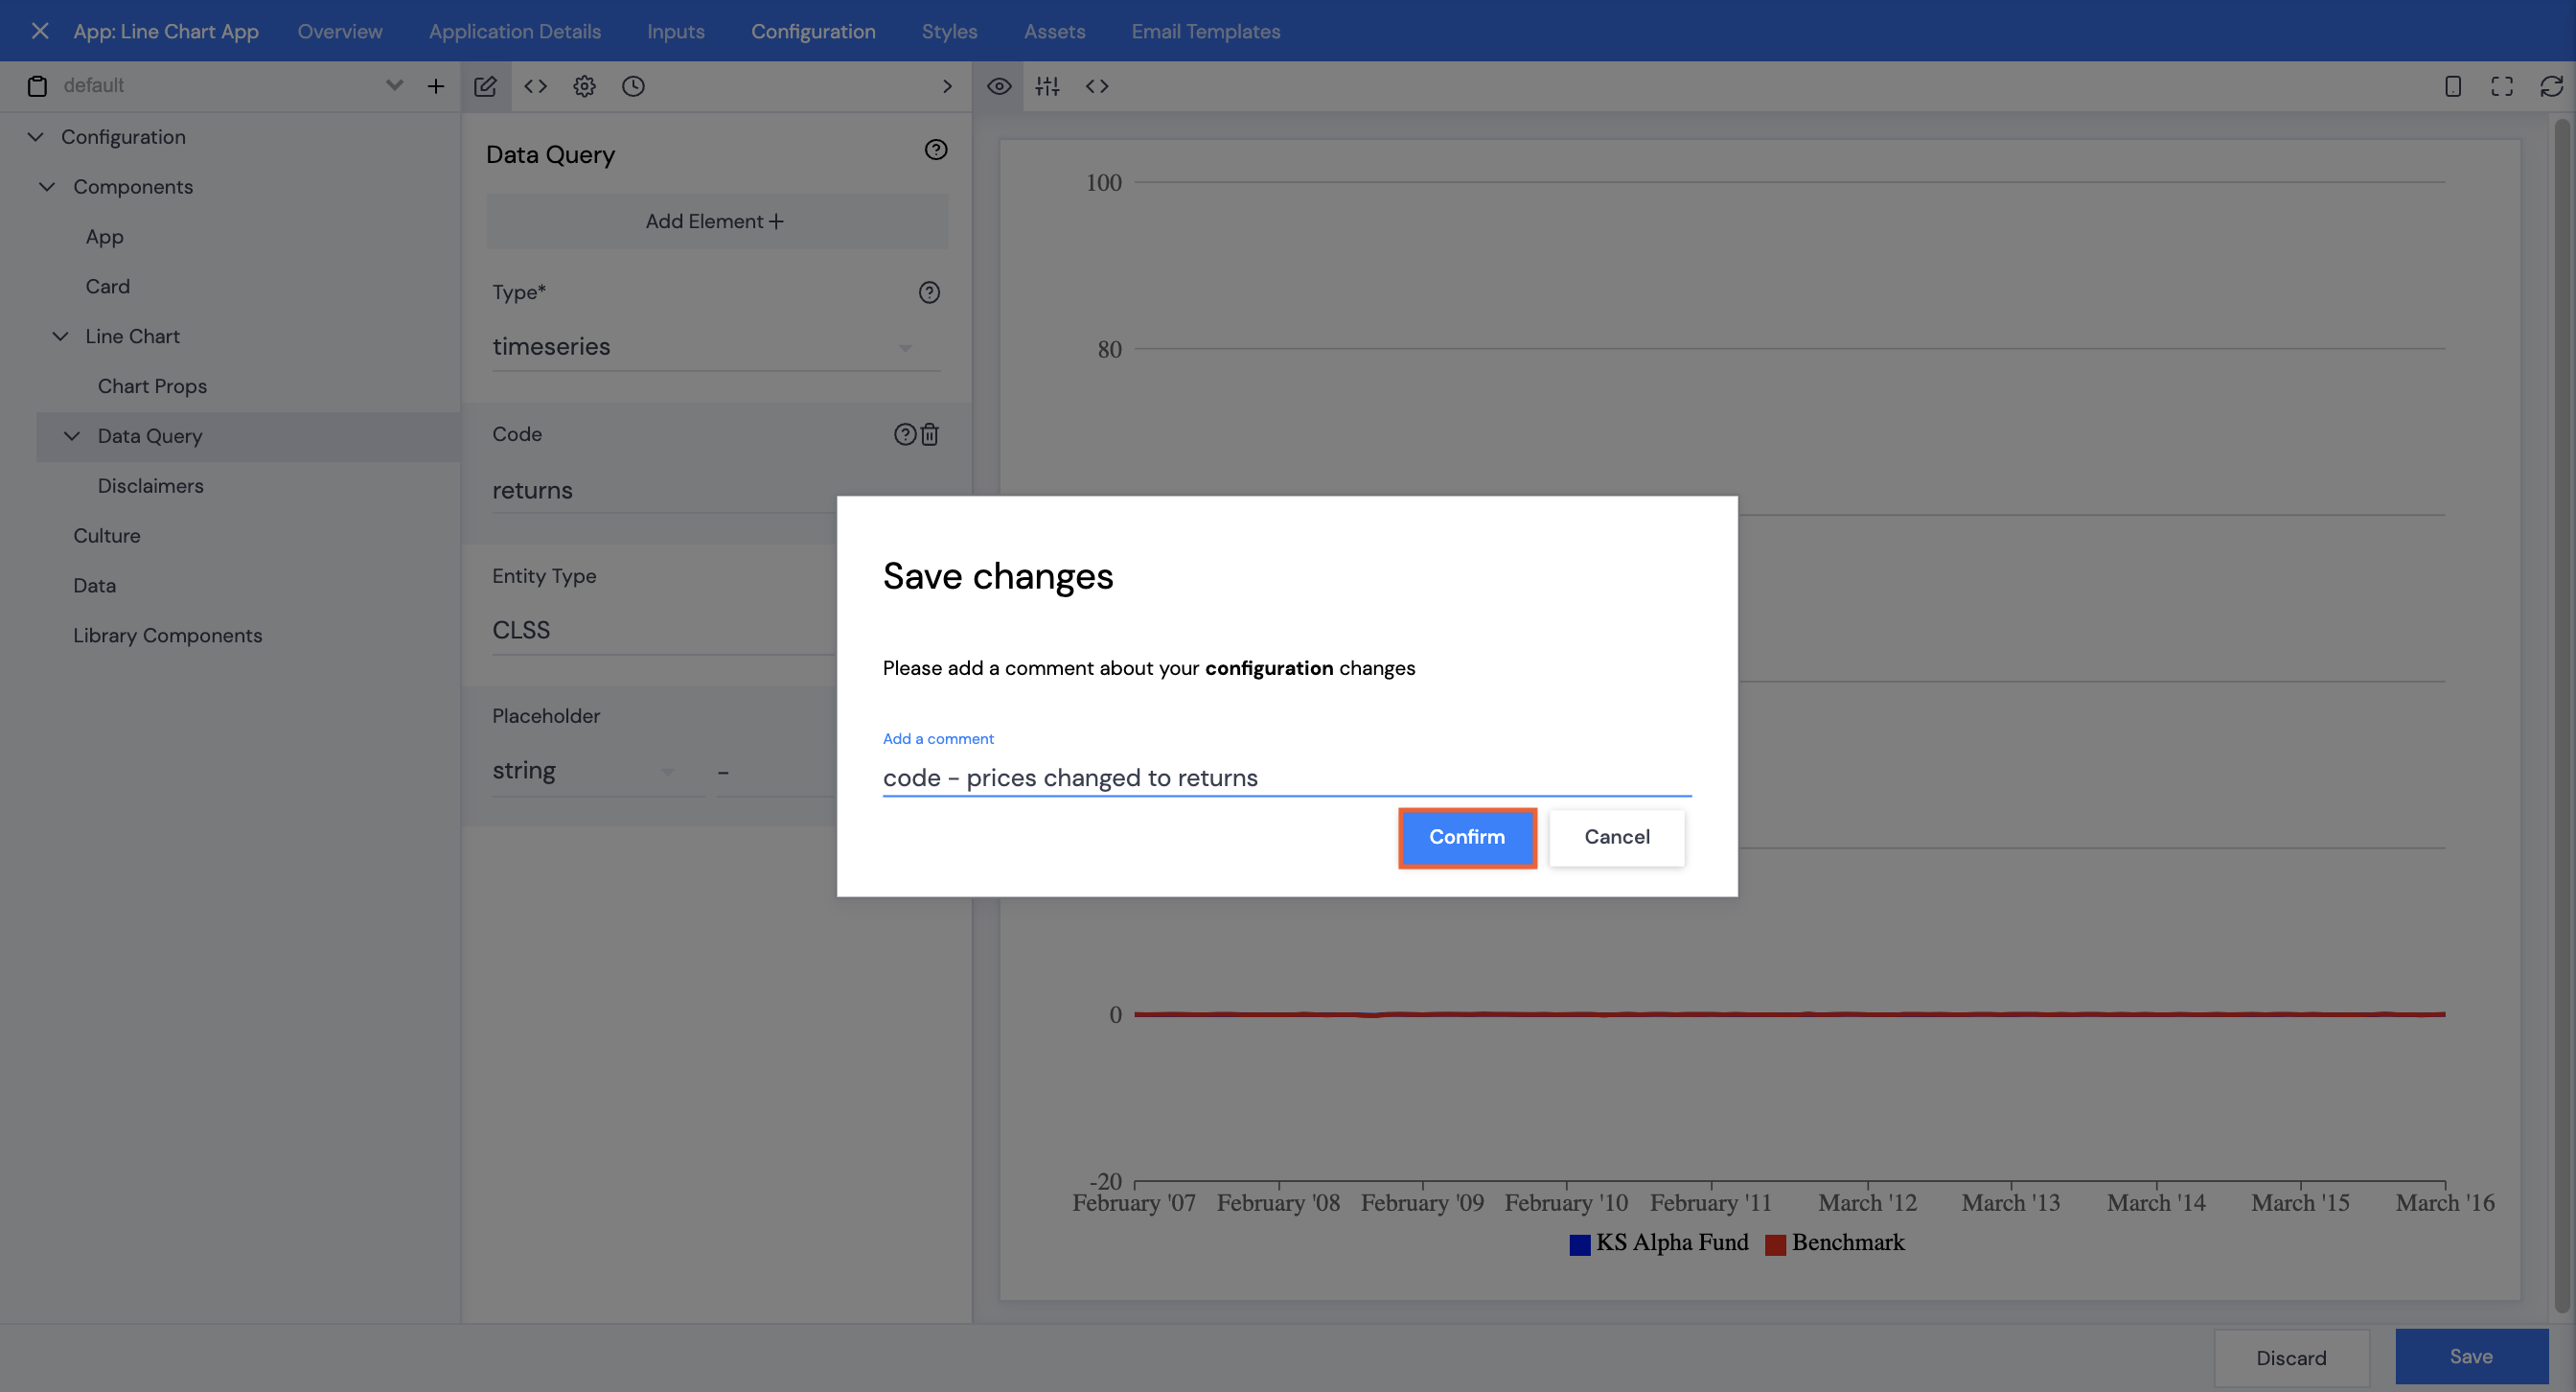
- Click Save.
- Type in a comment, then click Confirm.
Note: The lines (red and blue) are both present in the screenshot but look almost flat at 0, and on top of each other because the data has so many decimal places and is so similar. (See the screenshot below.) Rebasing will also allow the data to display more clearly.
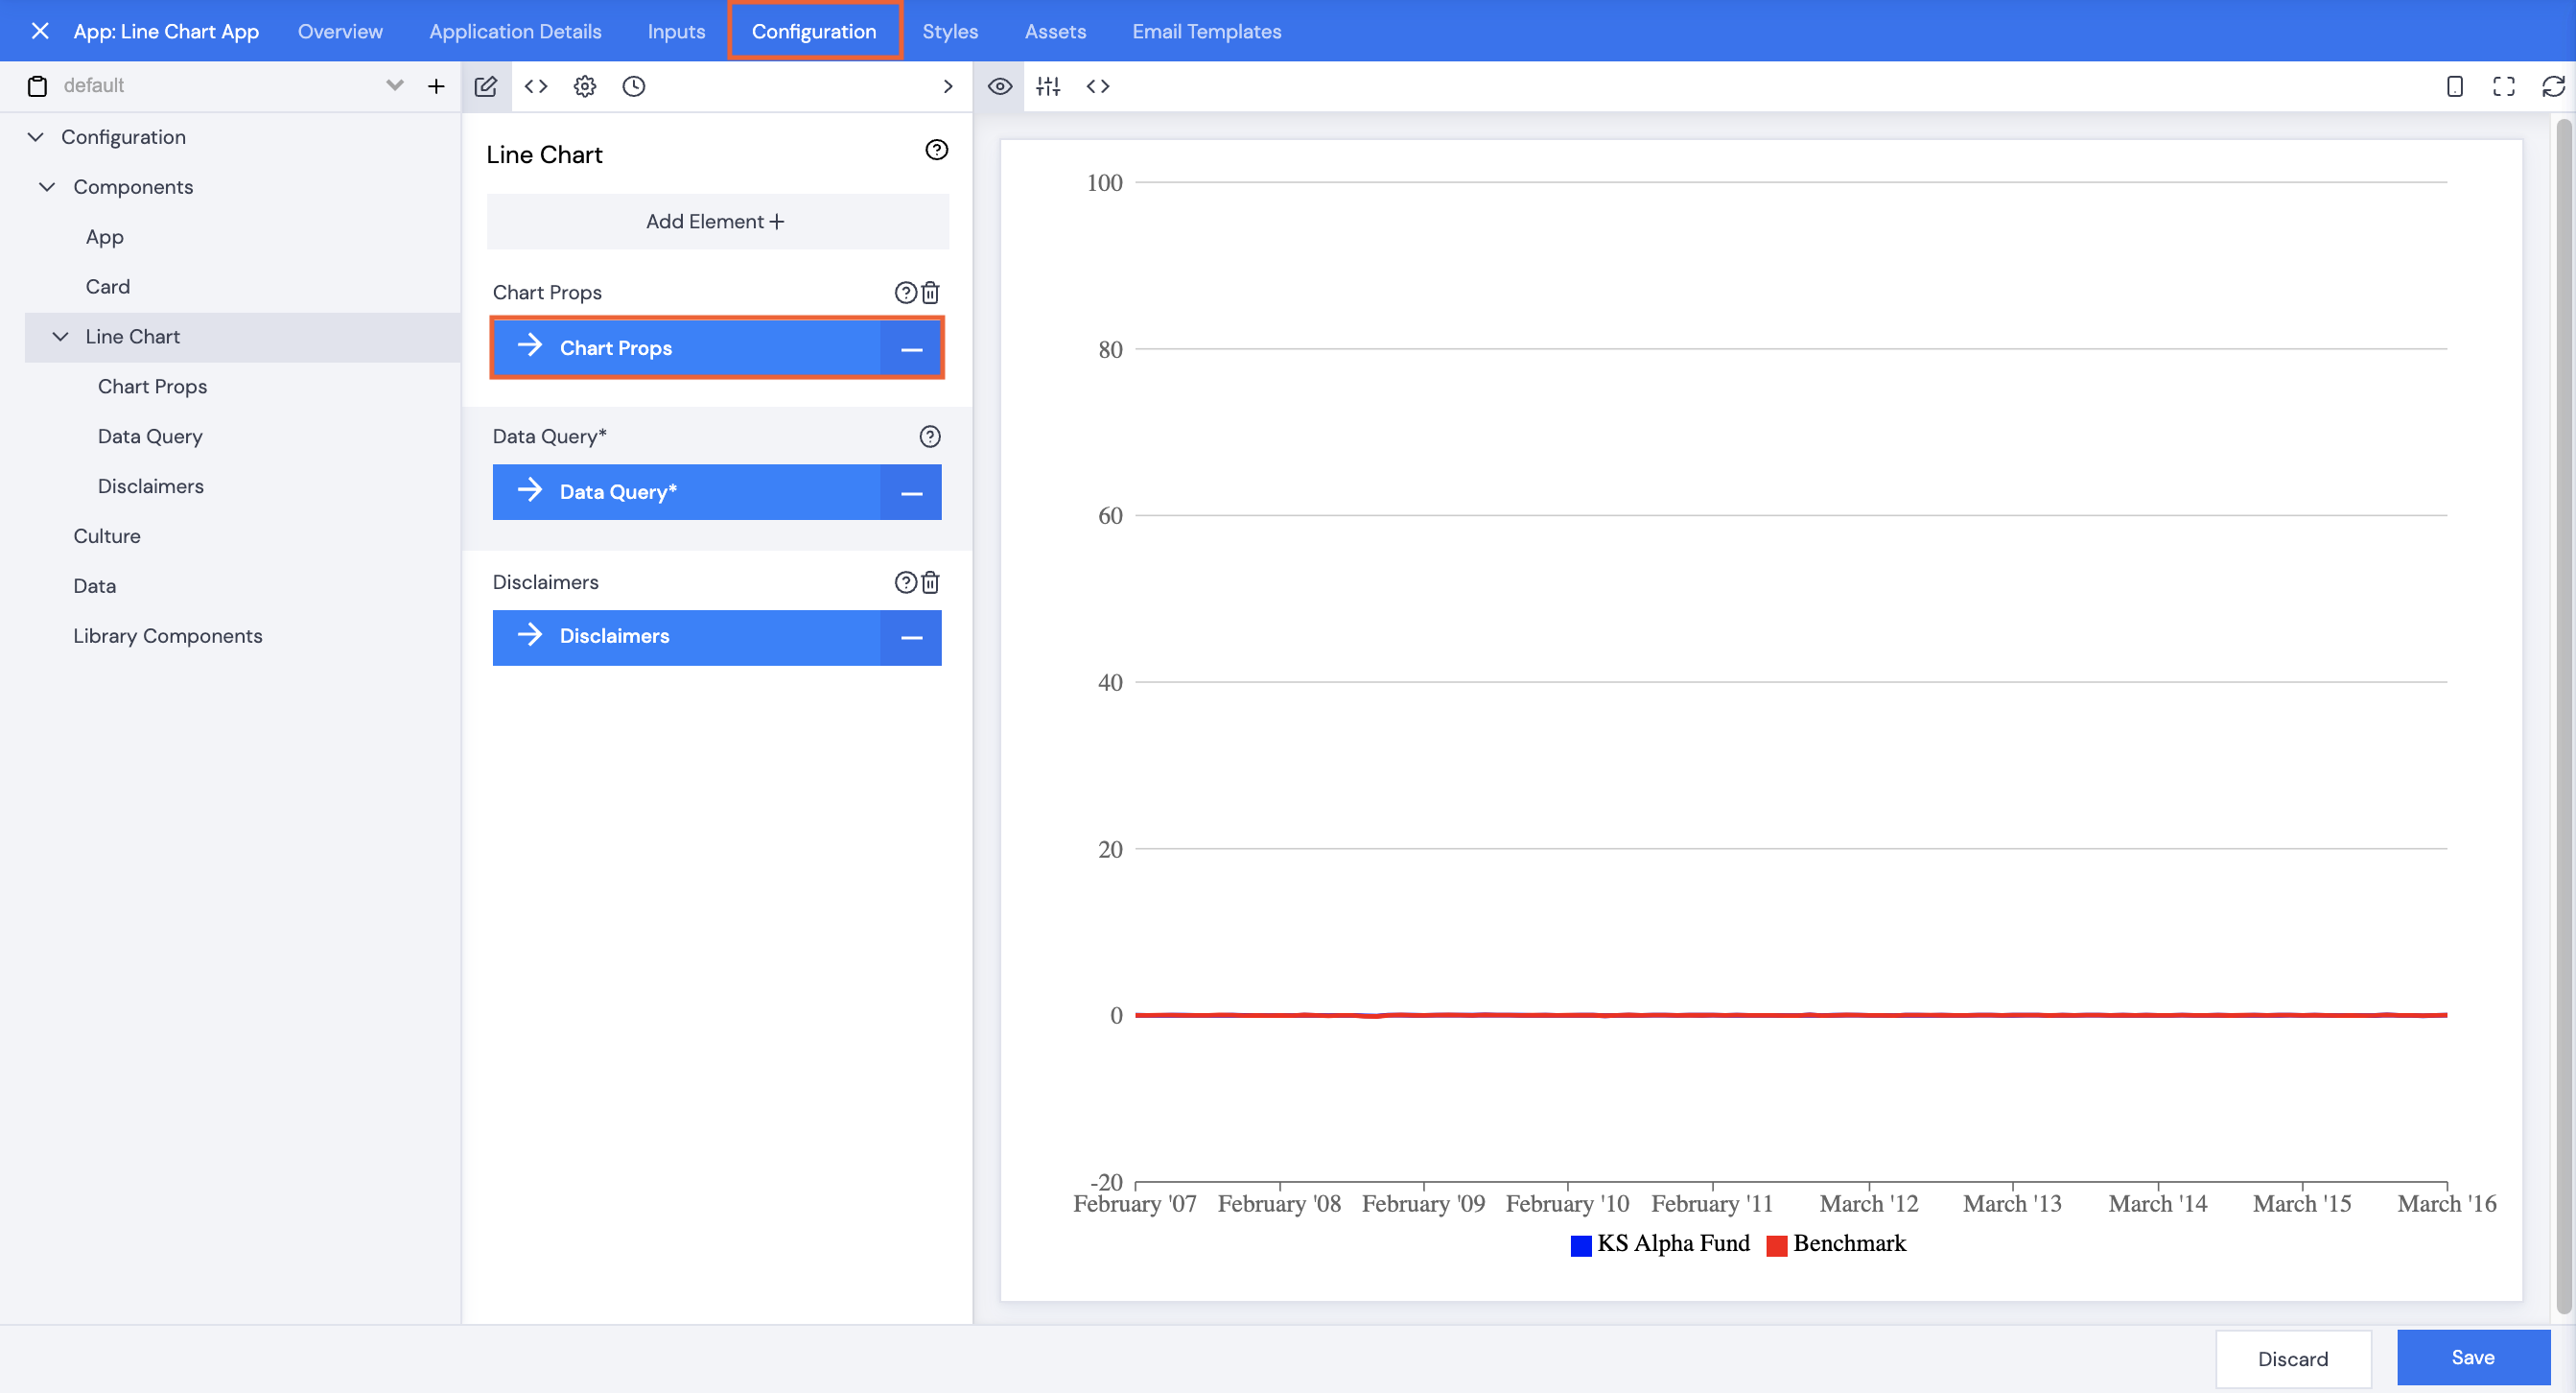
- To set up rebasing, with the Configuration tab selected, browse to Components | Line Chart, then click Chart Props.
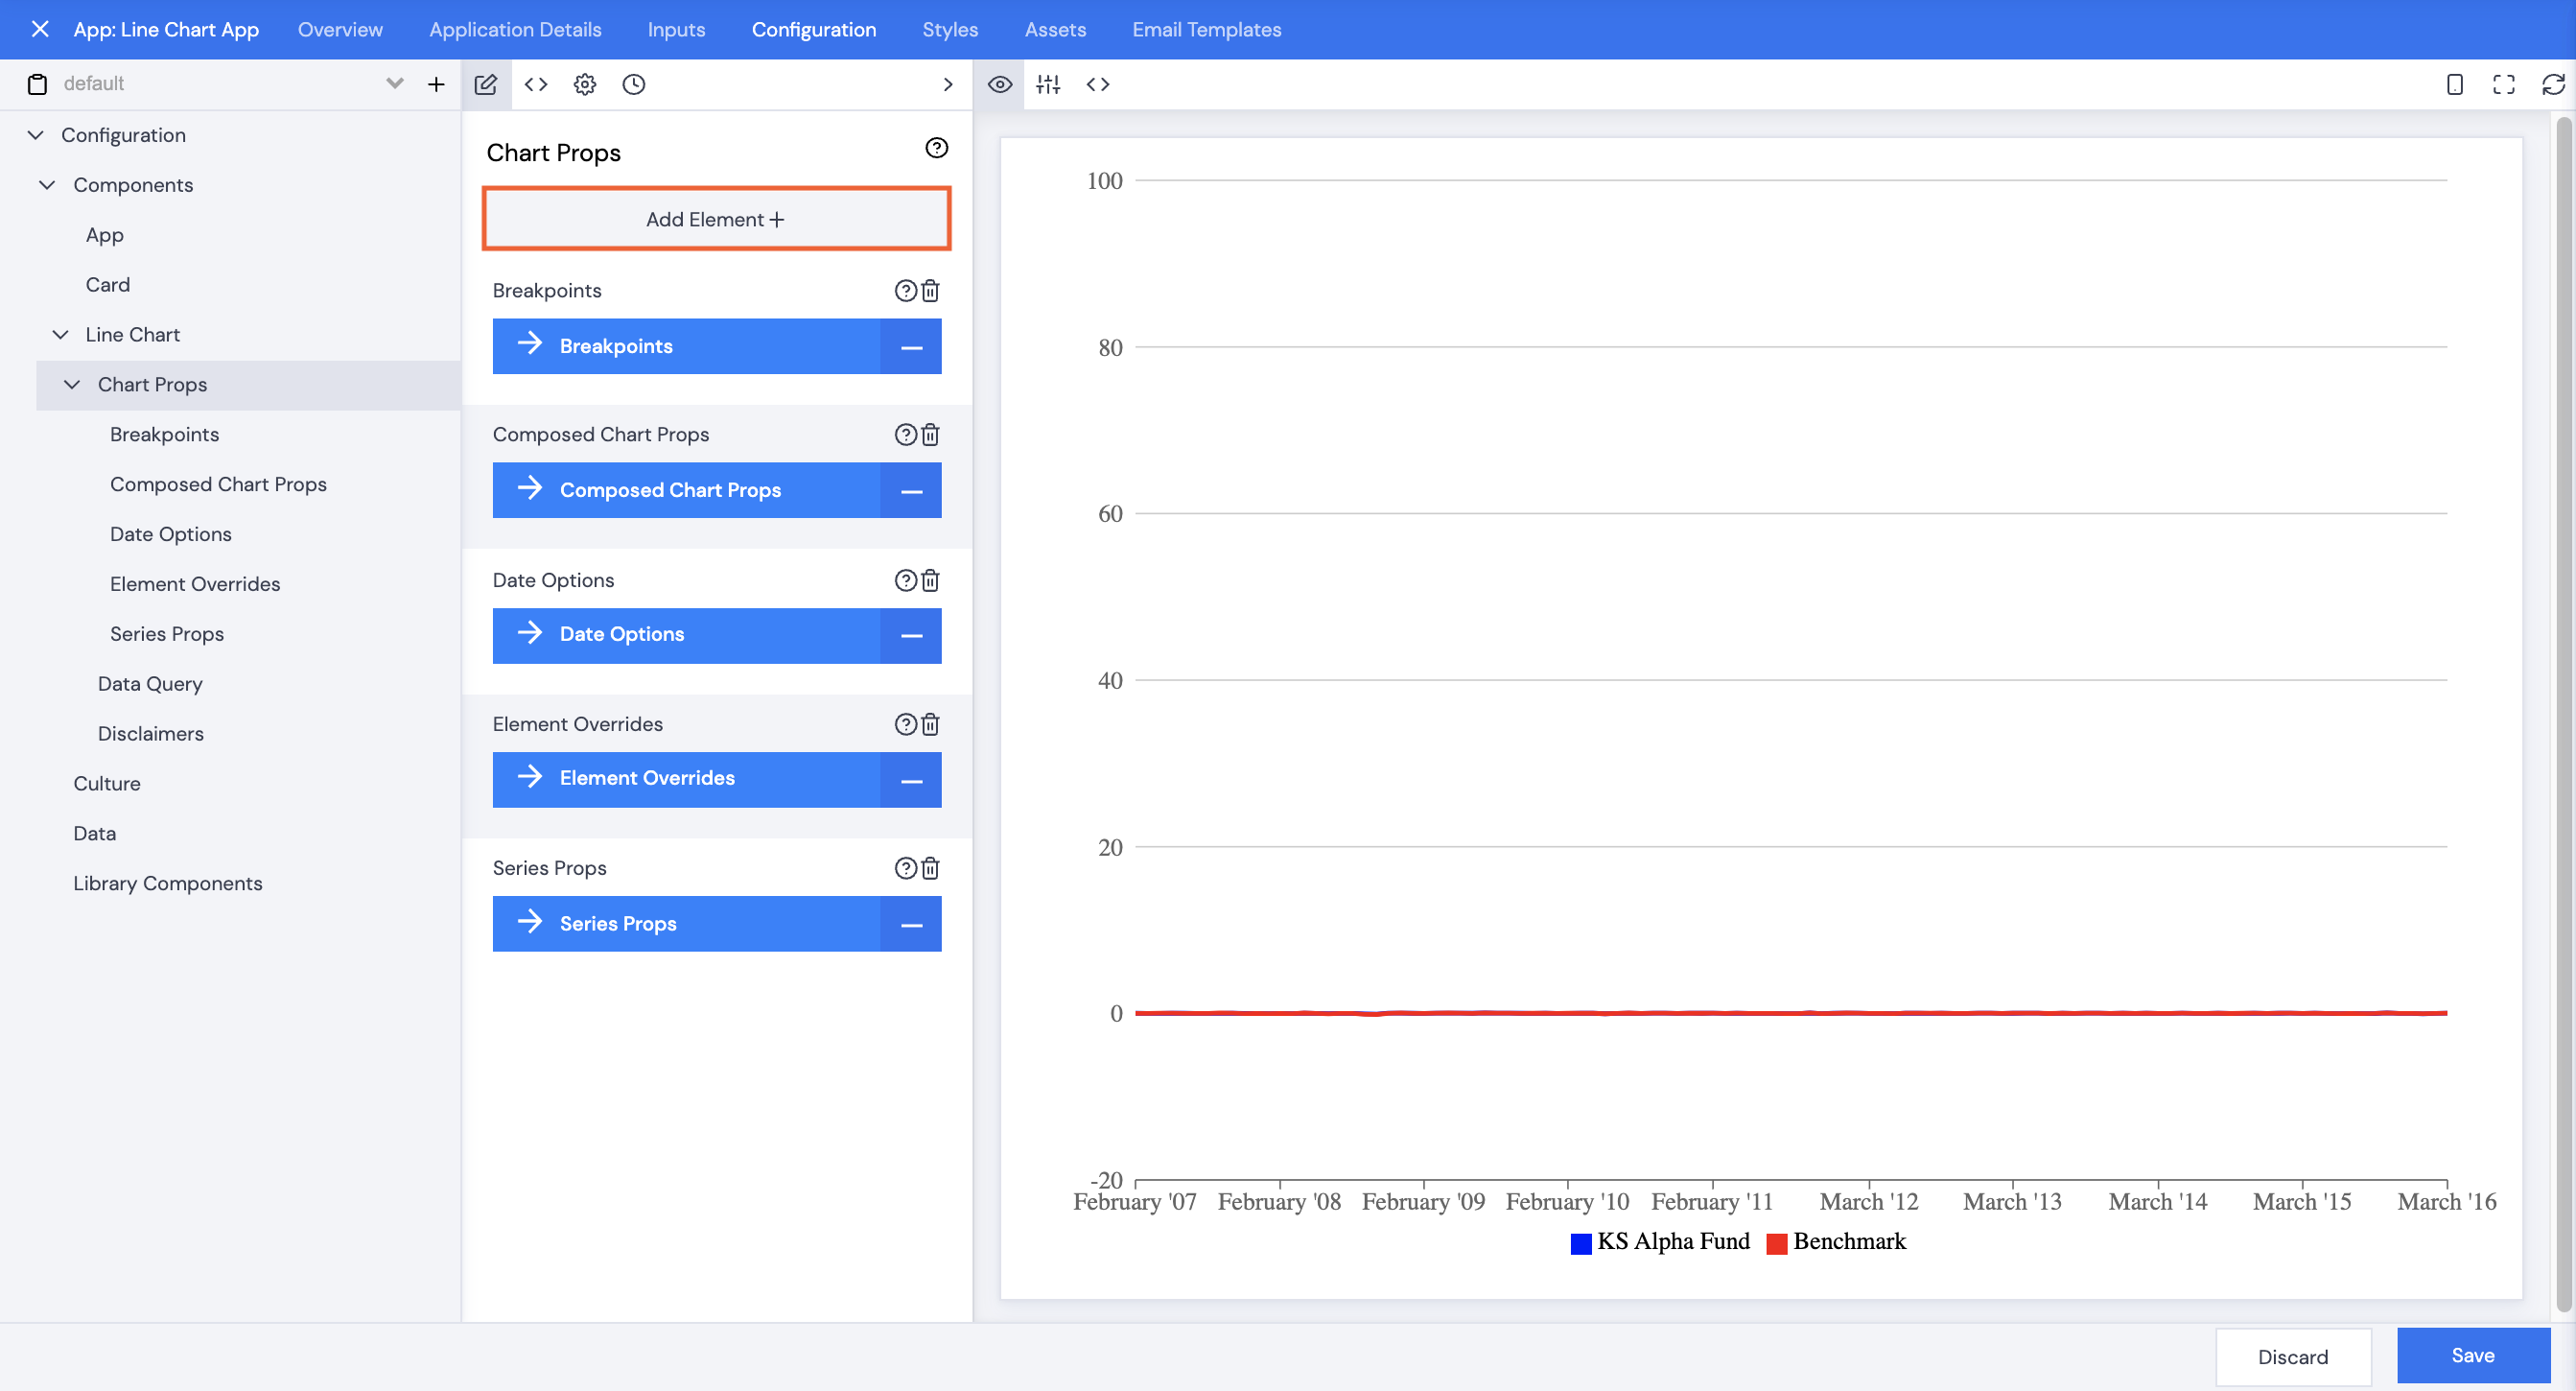
- Click Add Element+.
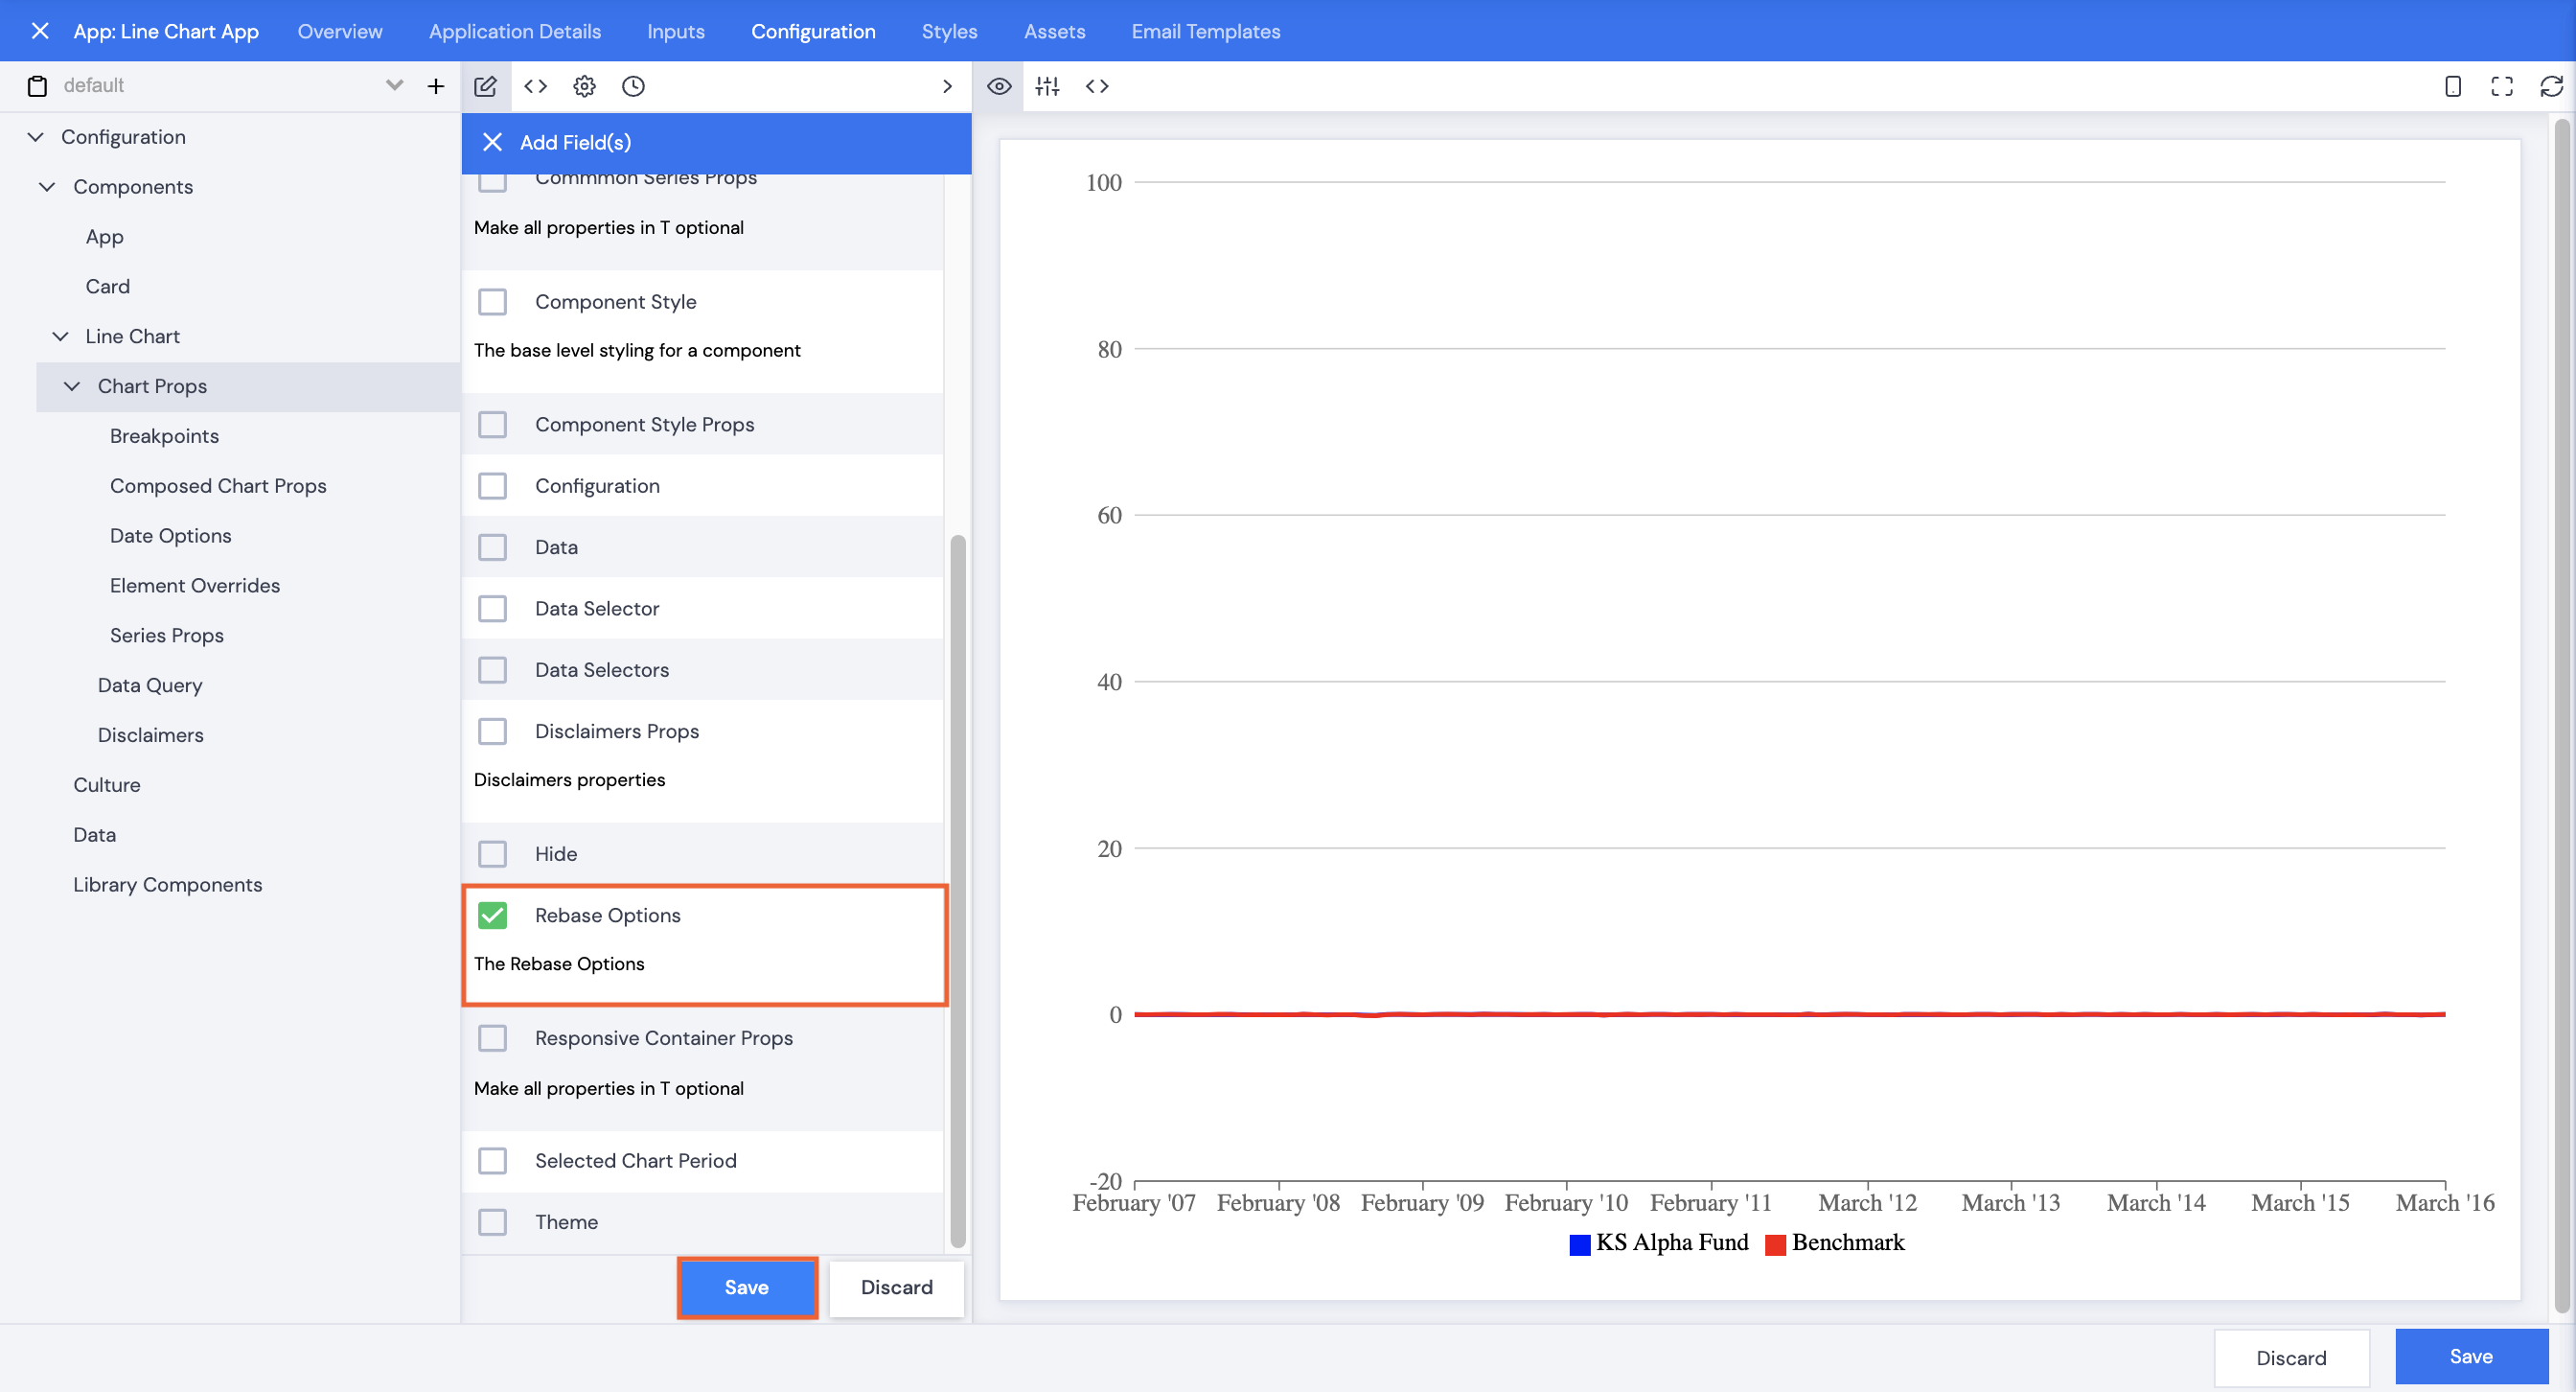
- Scroll down or use the search field to select Rebase Options.
- Click Save.
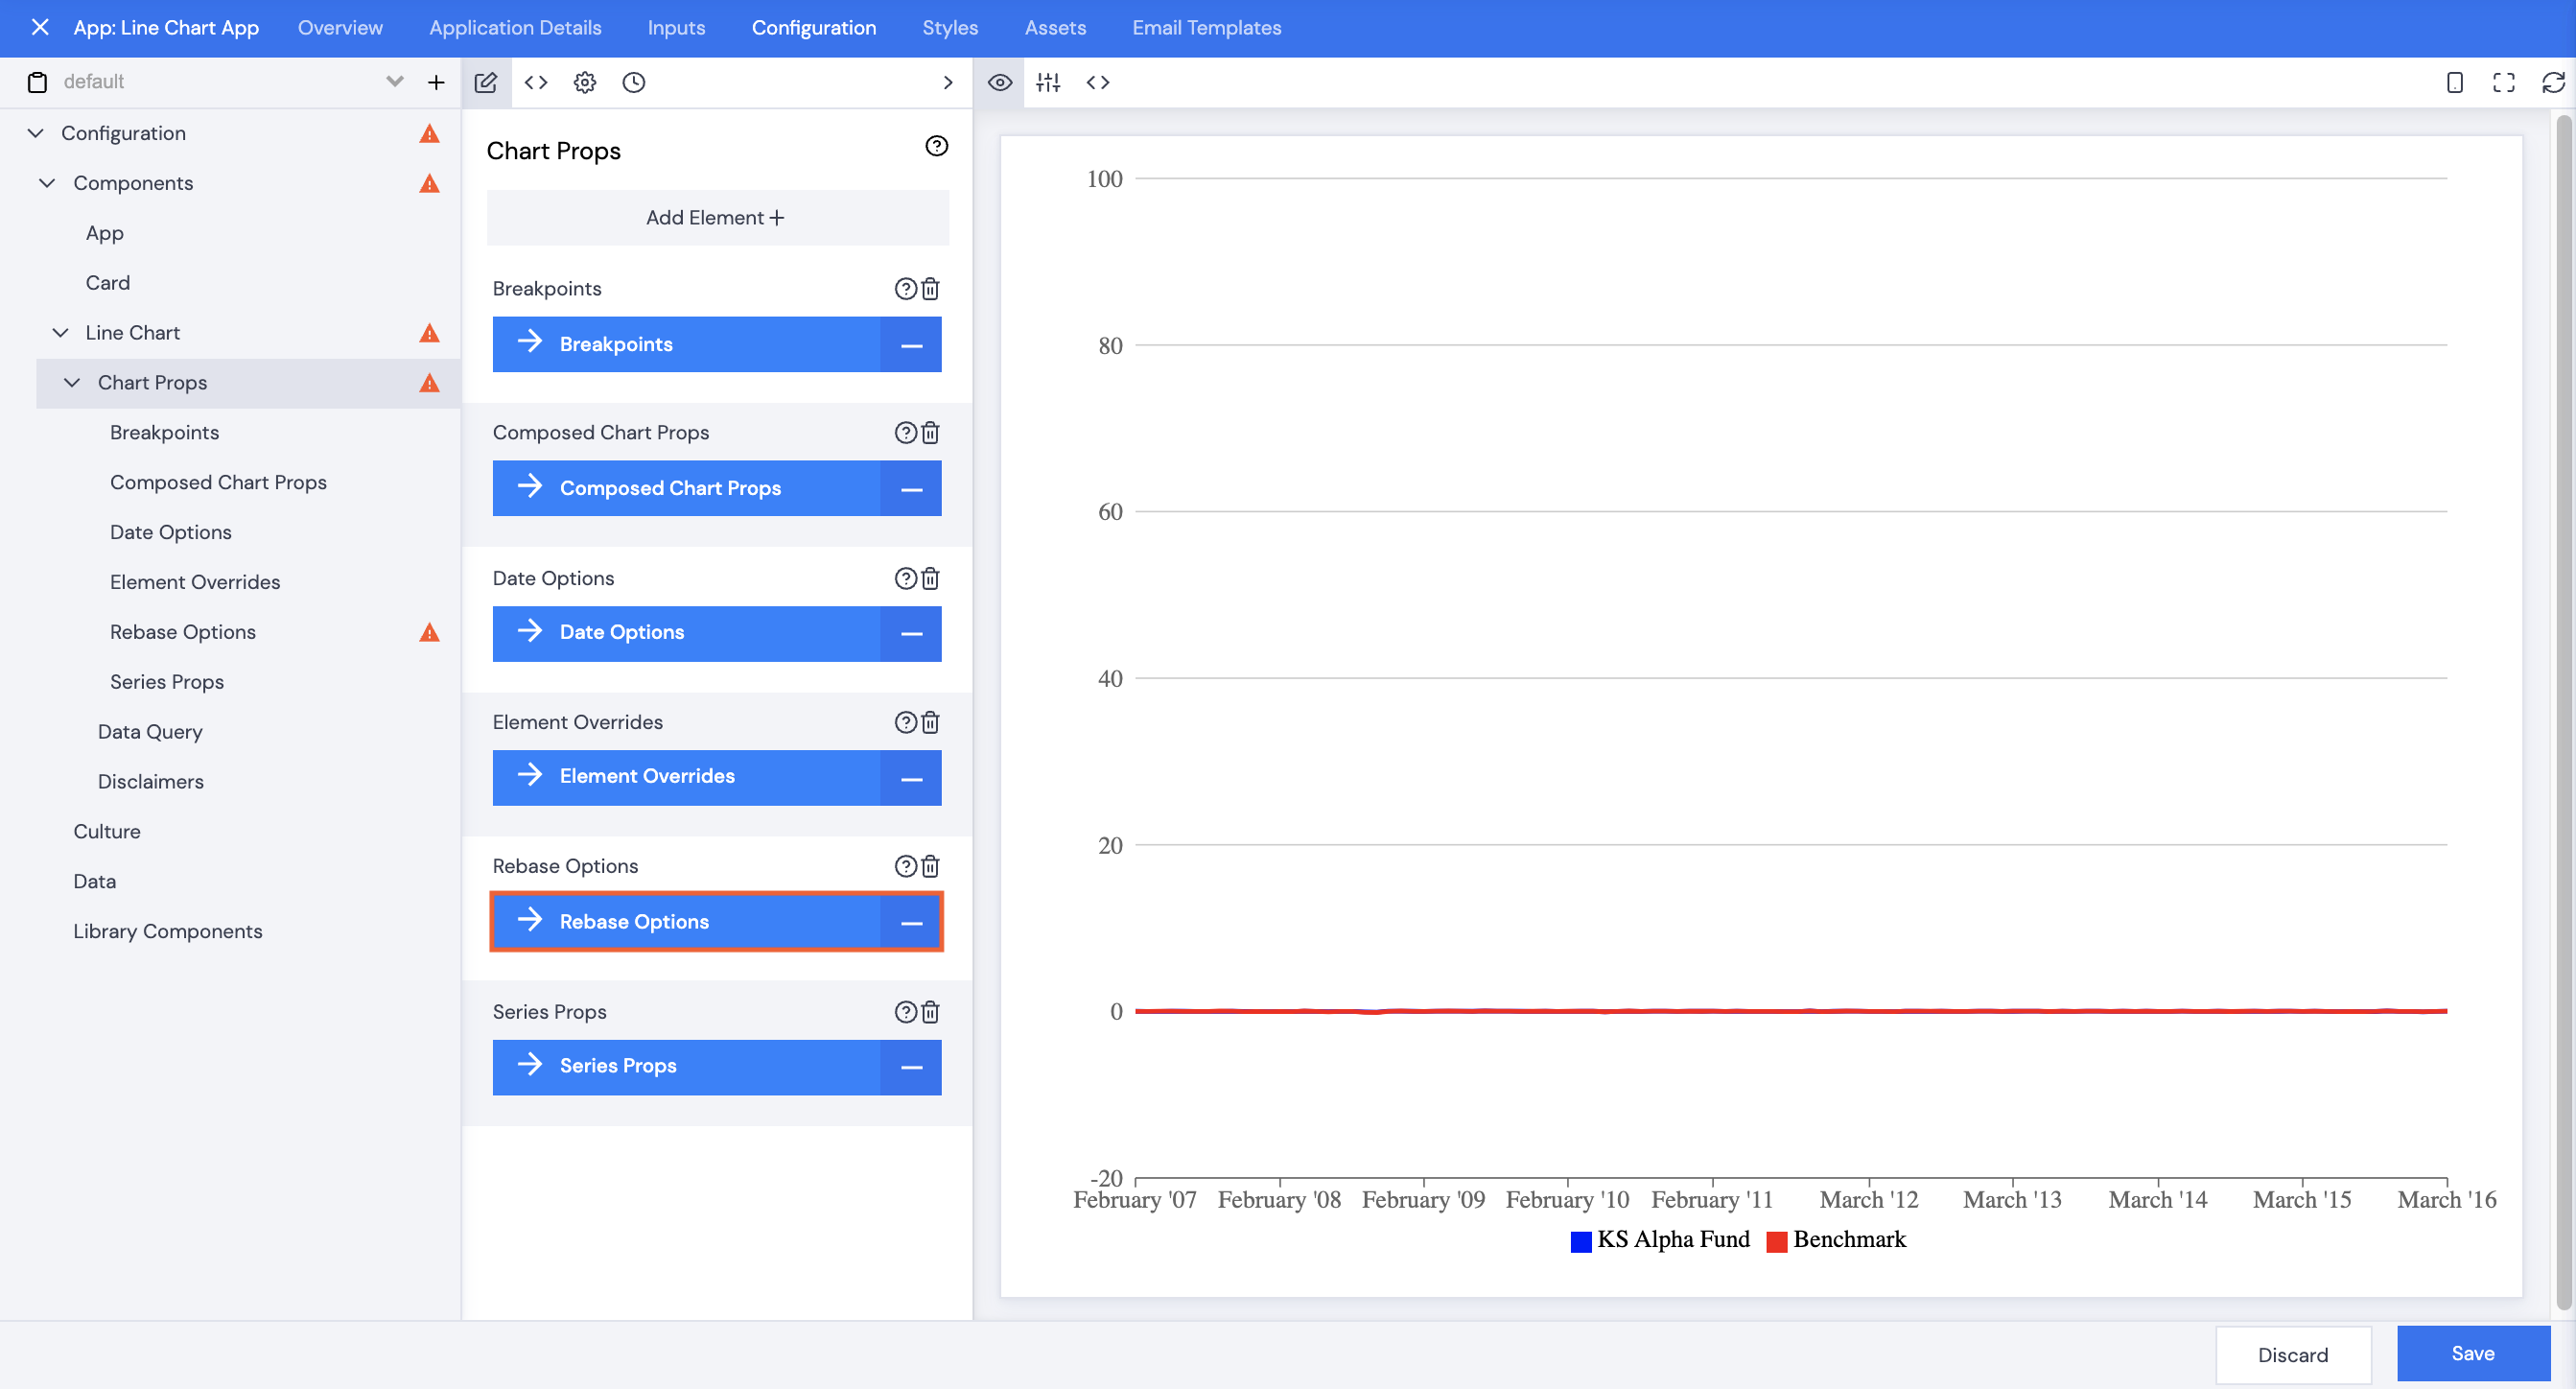
- Click Rebase Options.
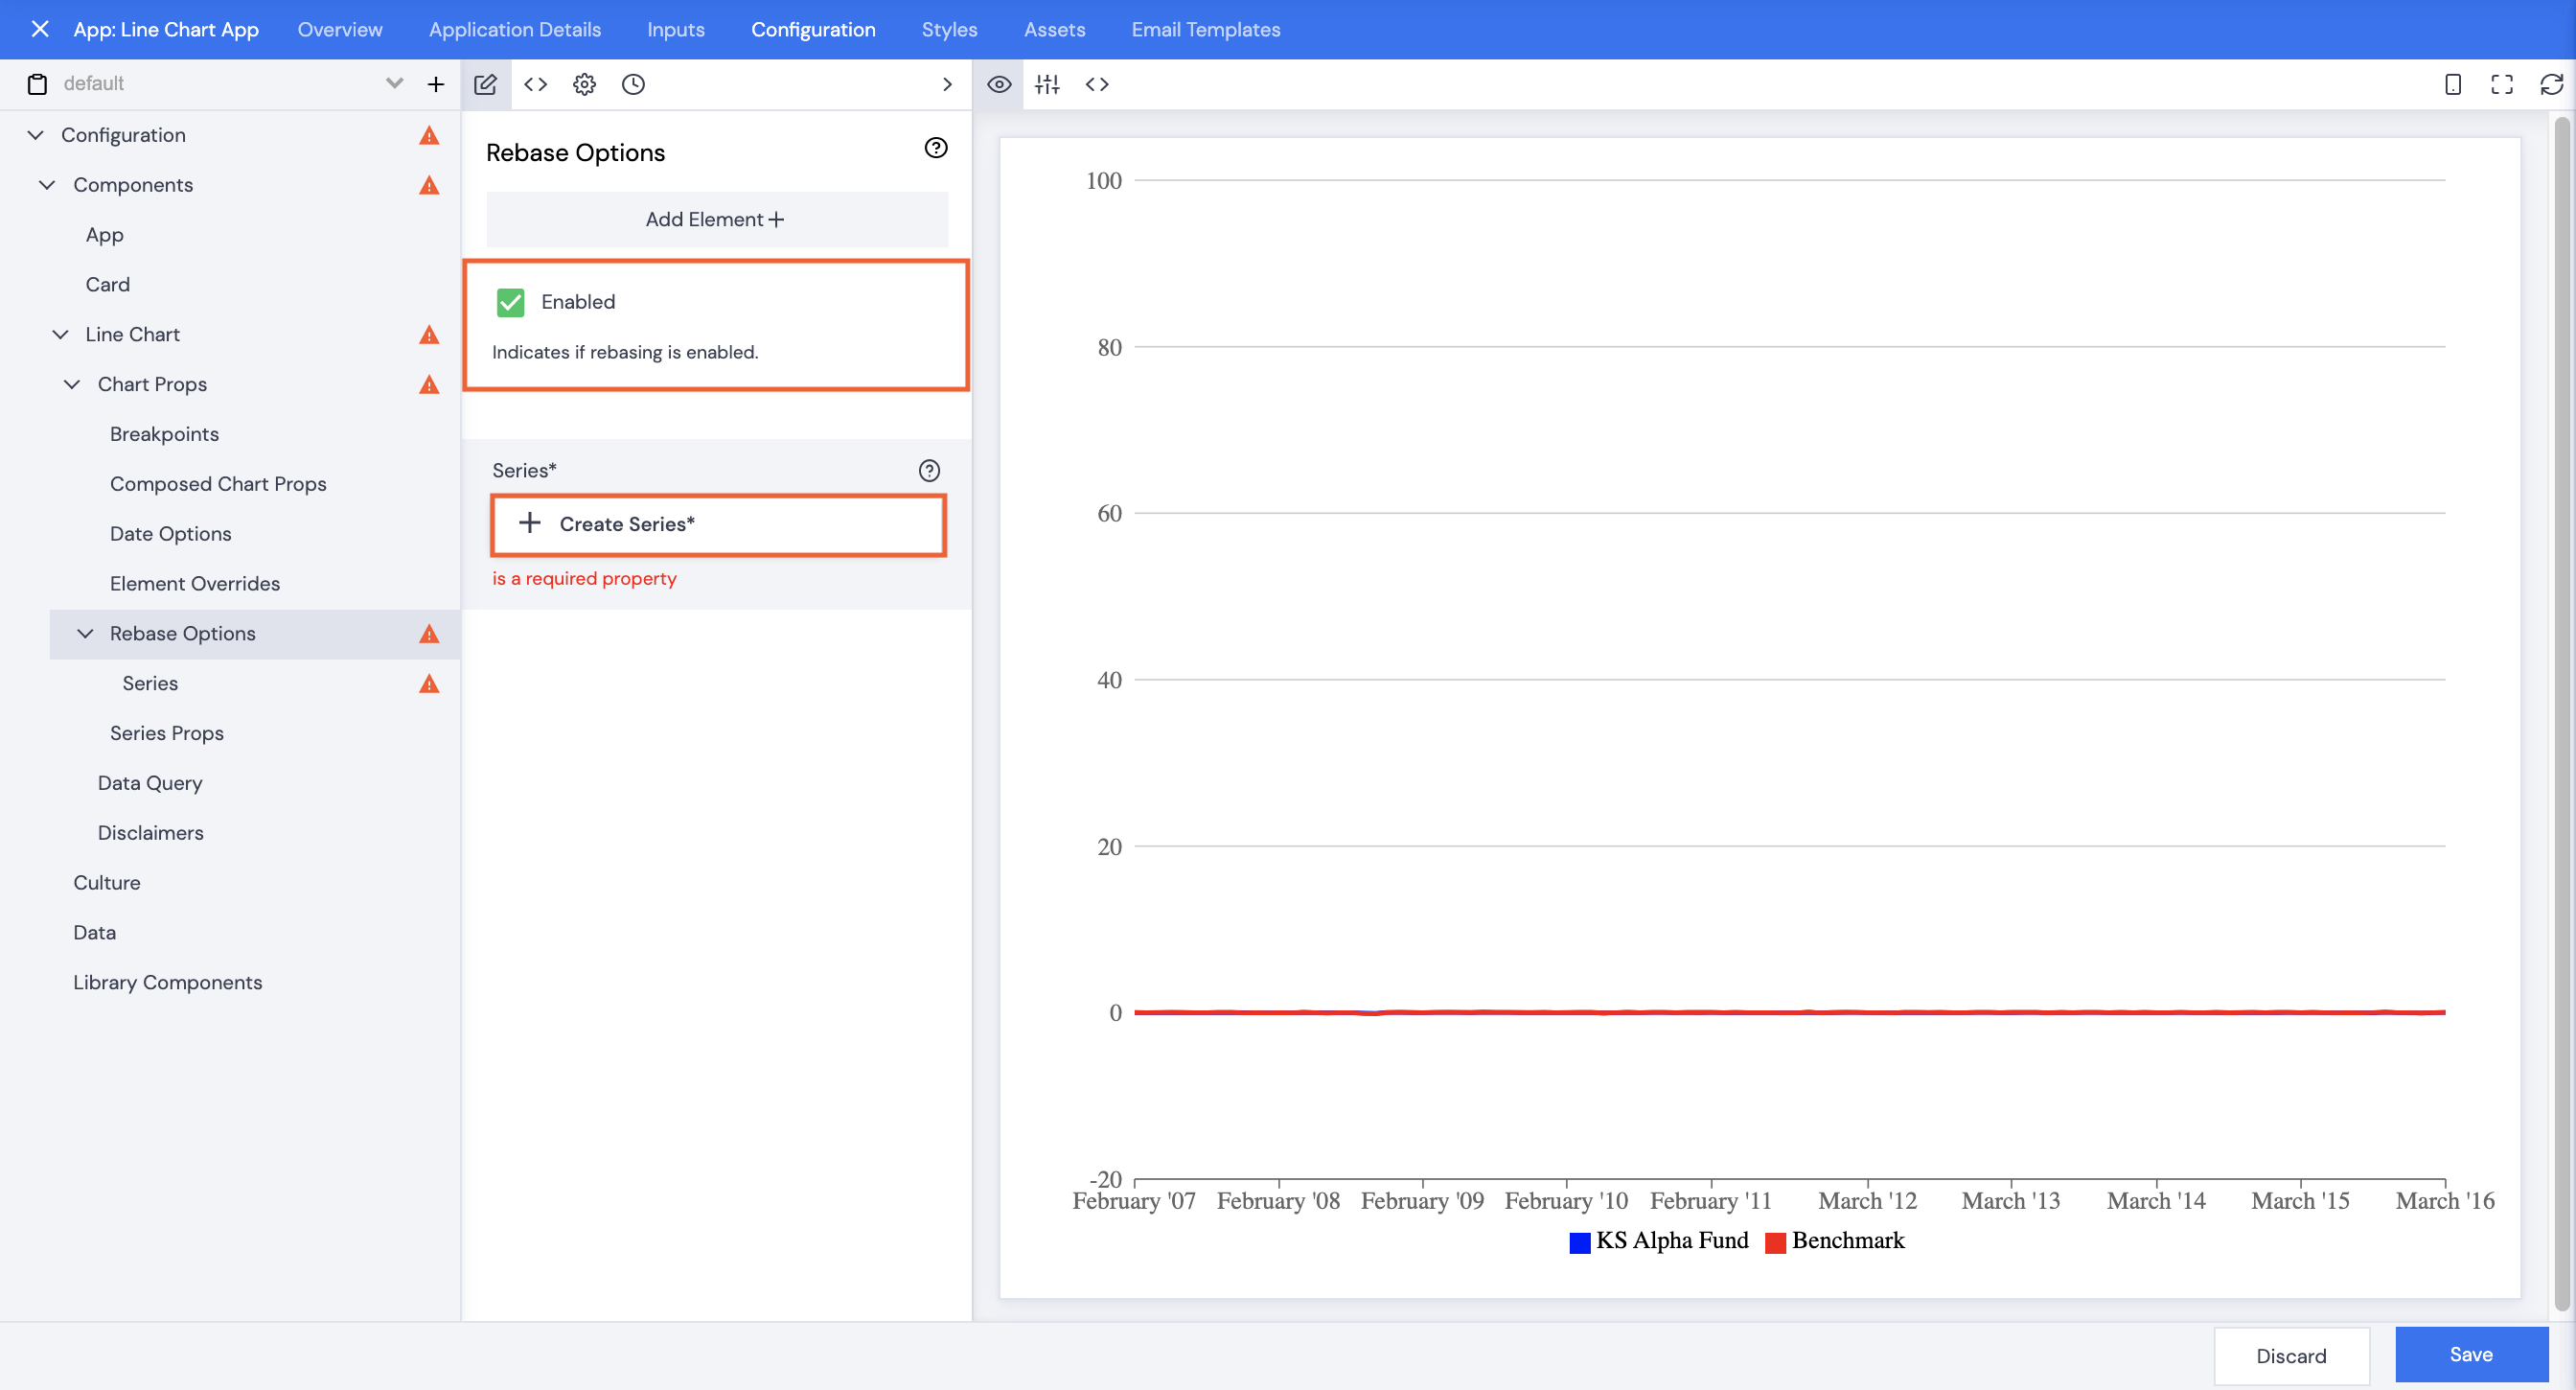
Rebasing must be set up for both lines.
- Check the Enabled checkbox to allow rebasing.
- Click + Create Series.
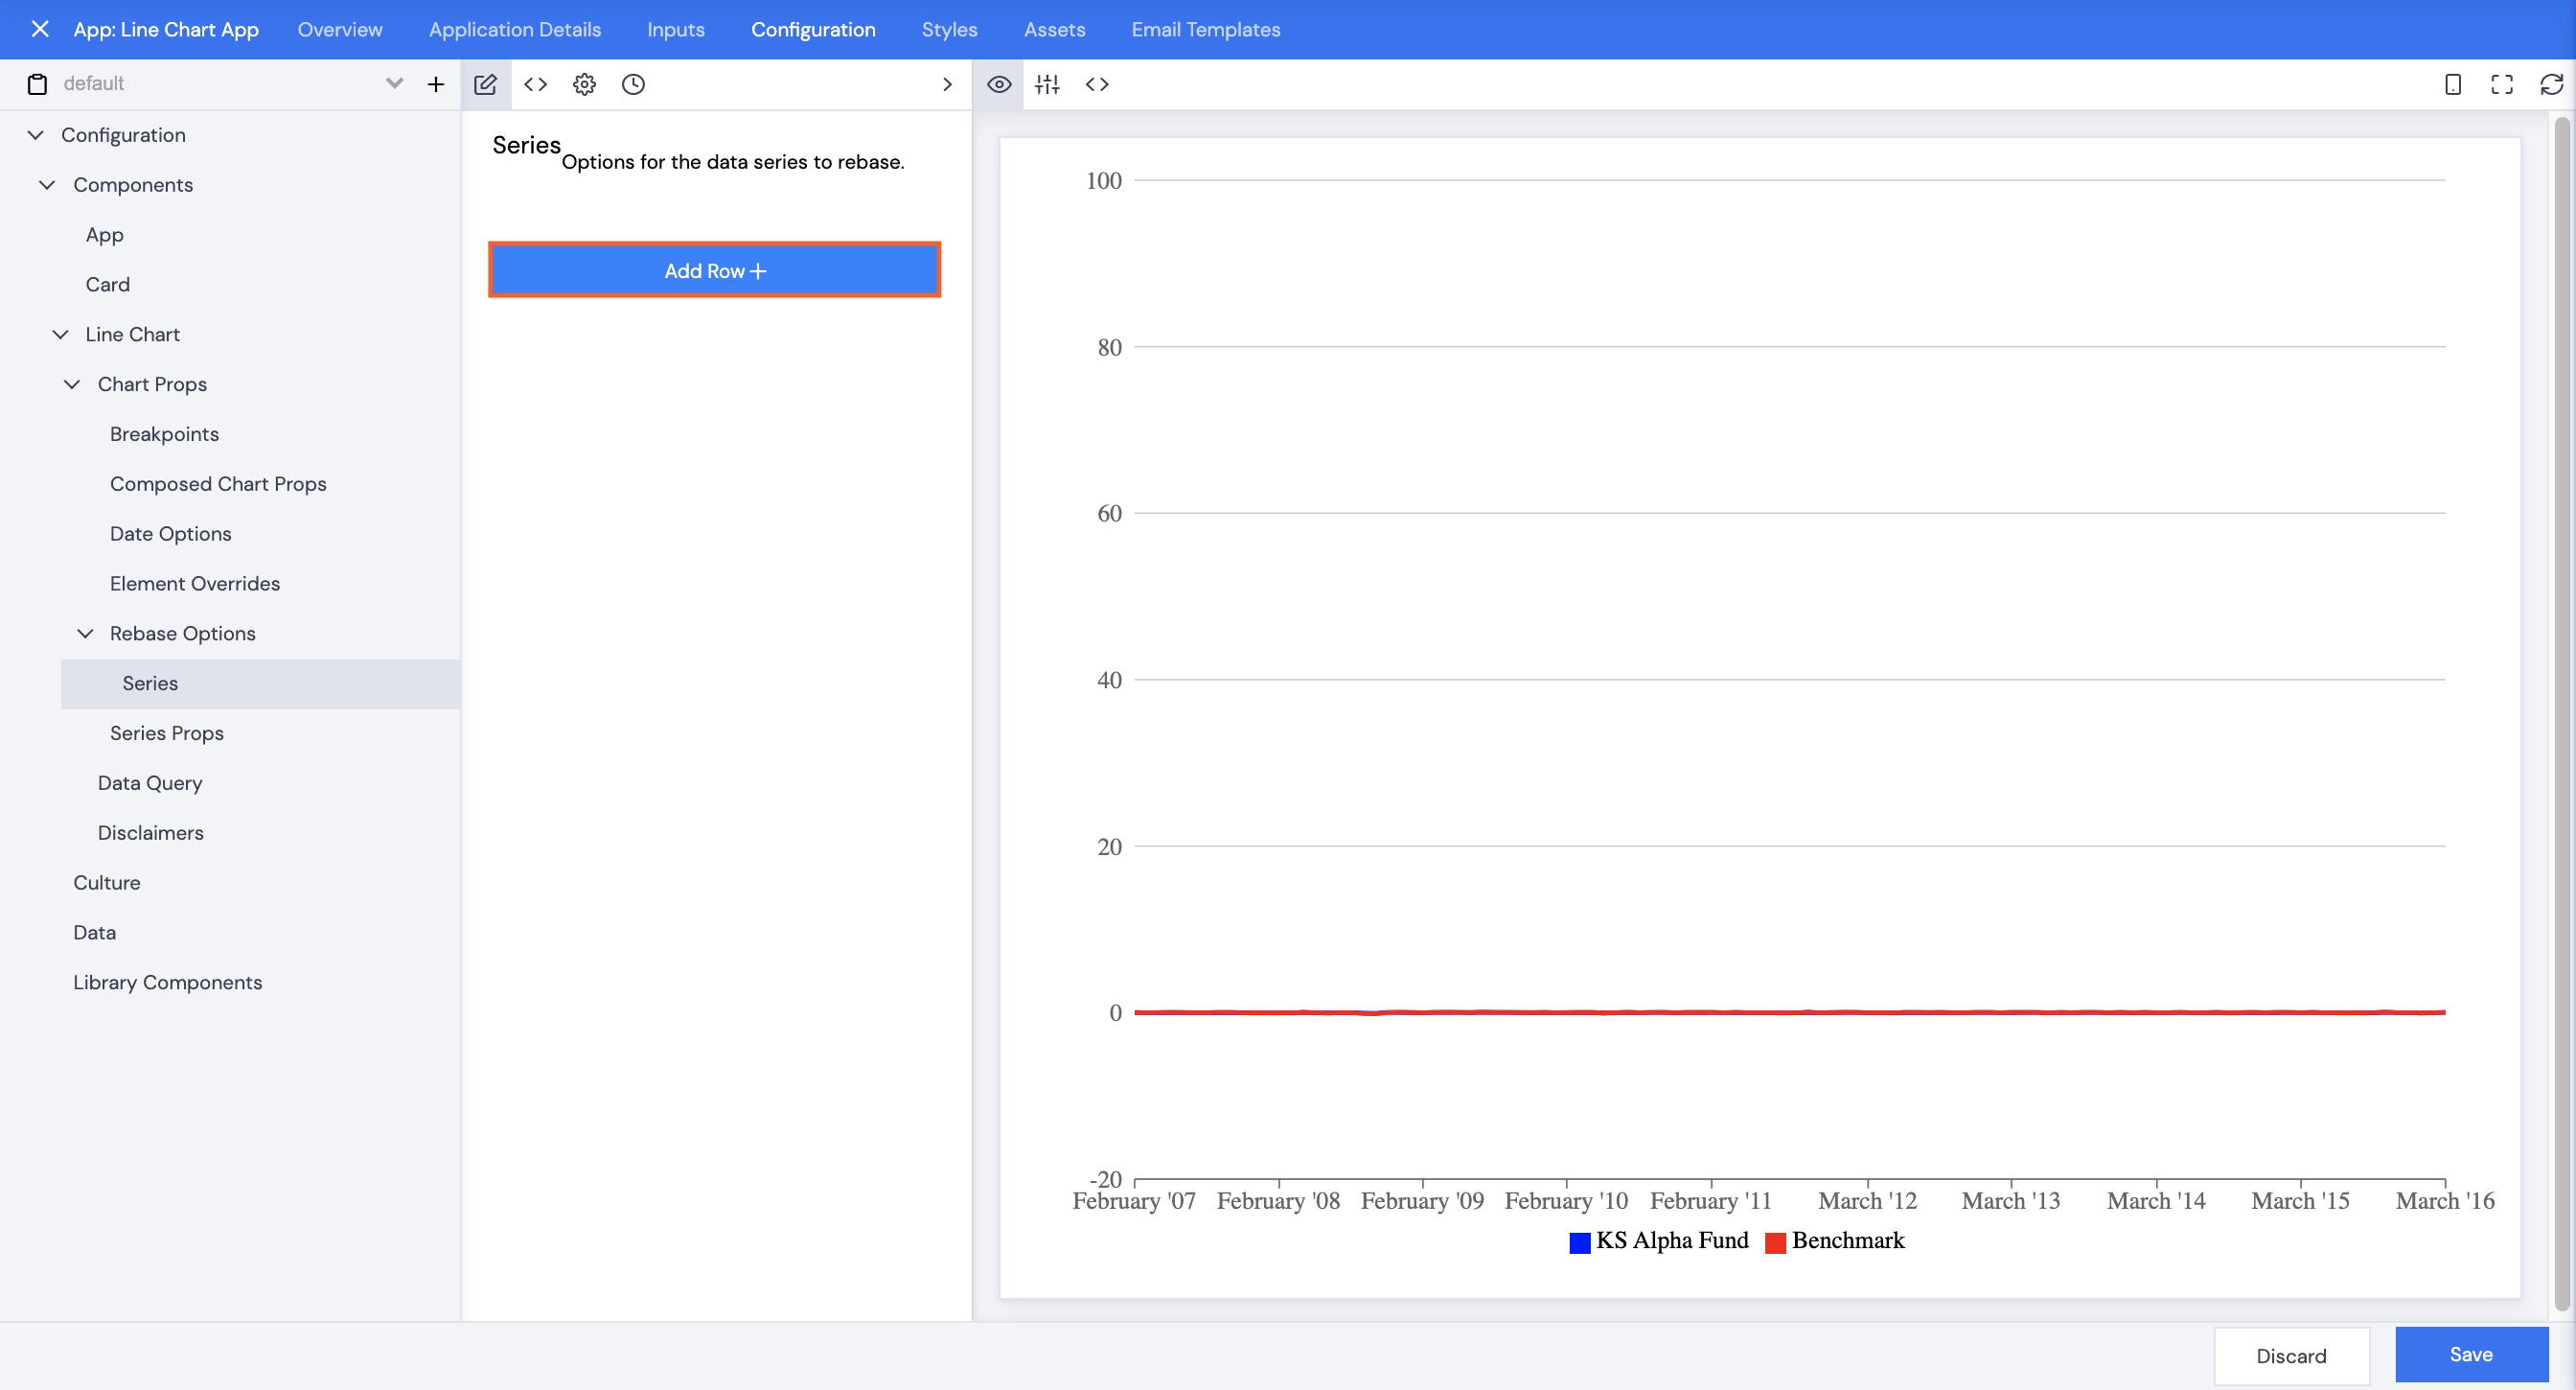
- Click Add Row+. This is to set up the properties (for the timeseries) which will have rebasing applied.
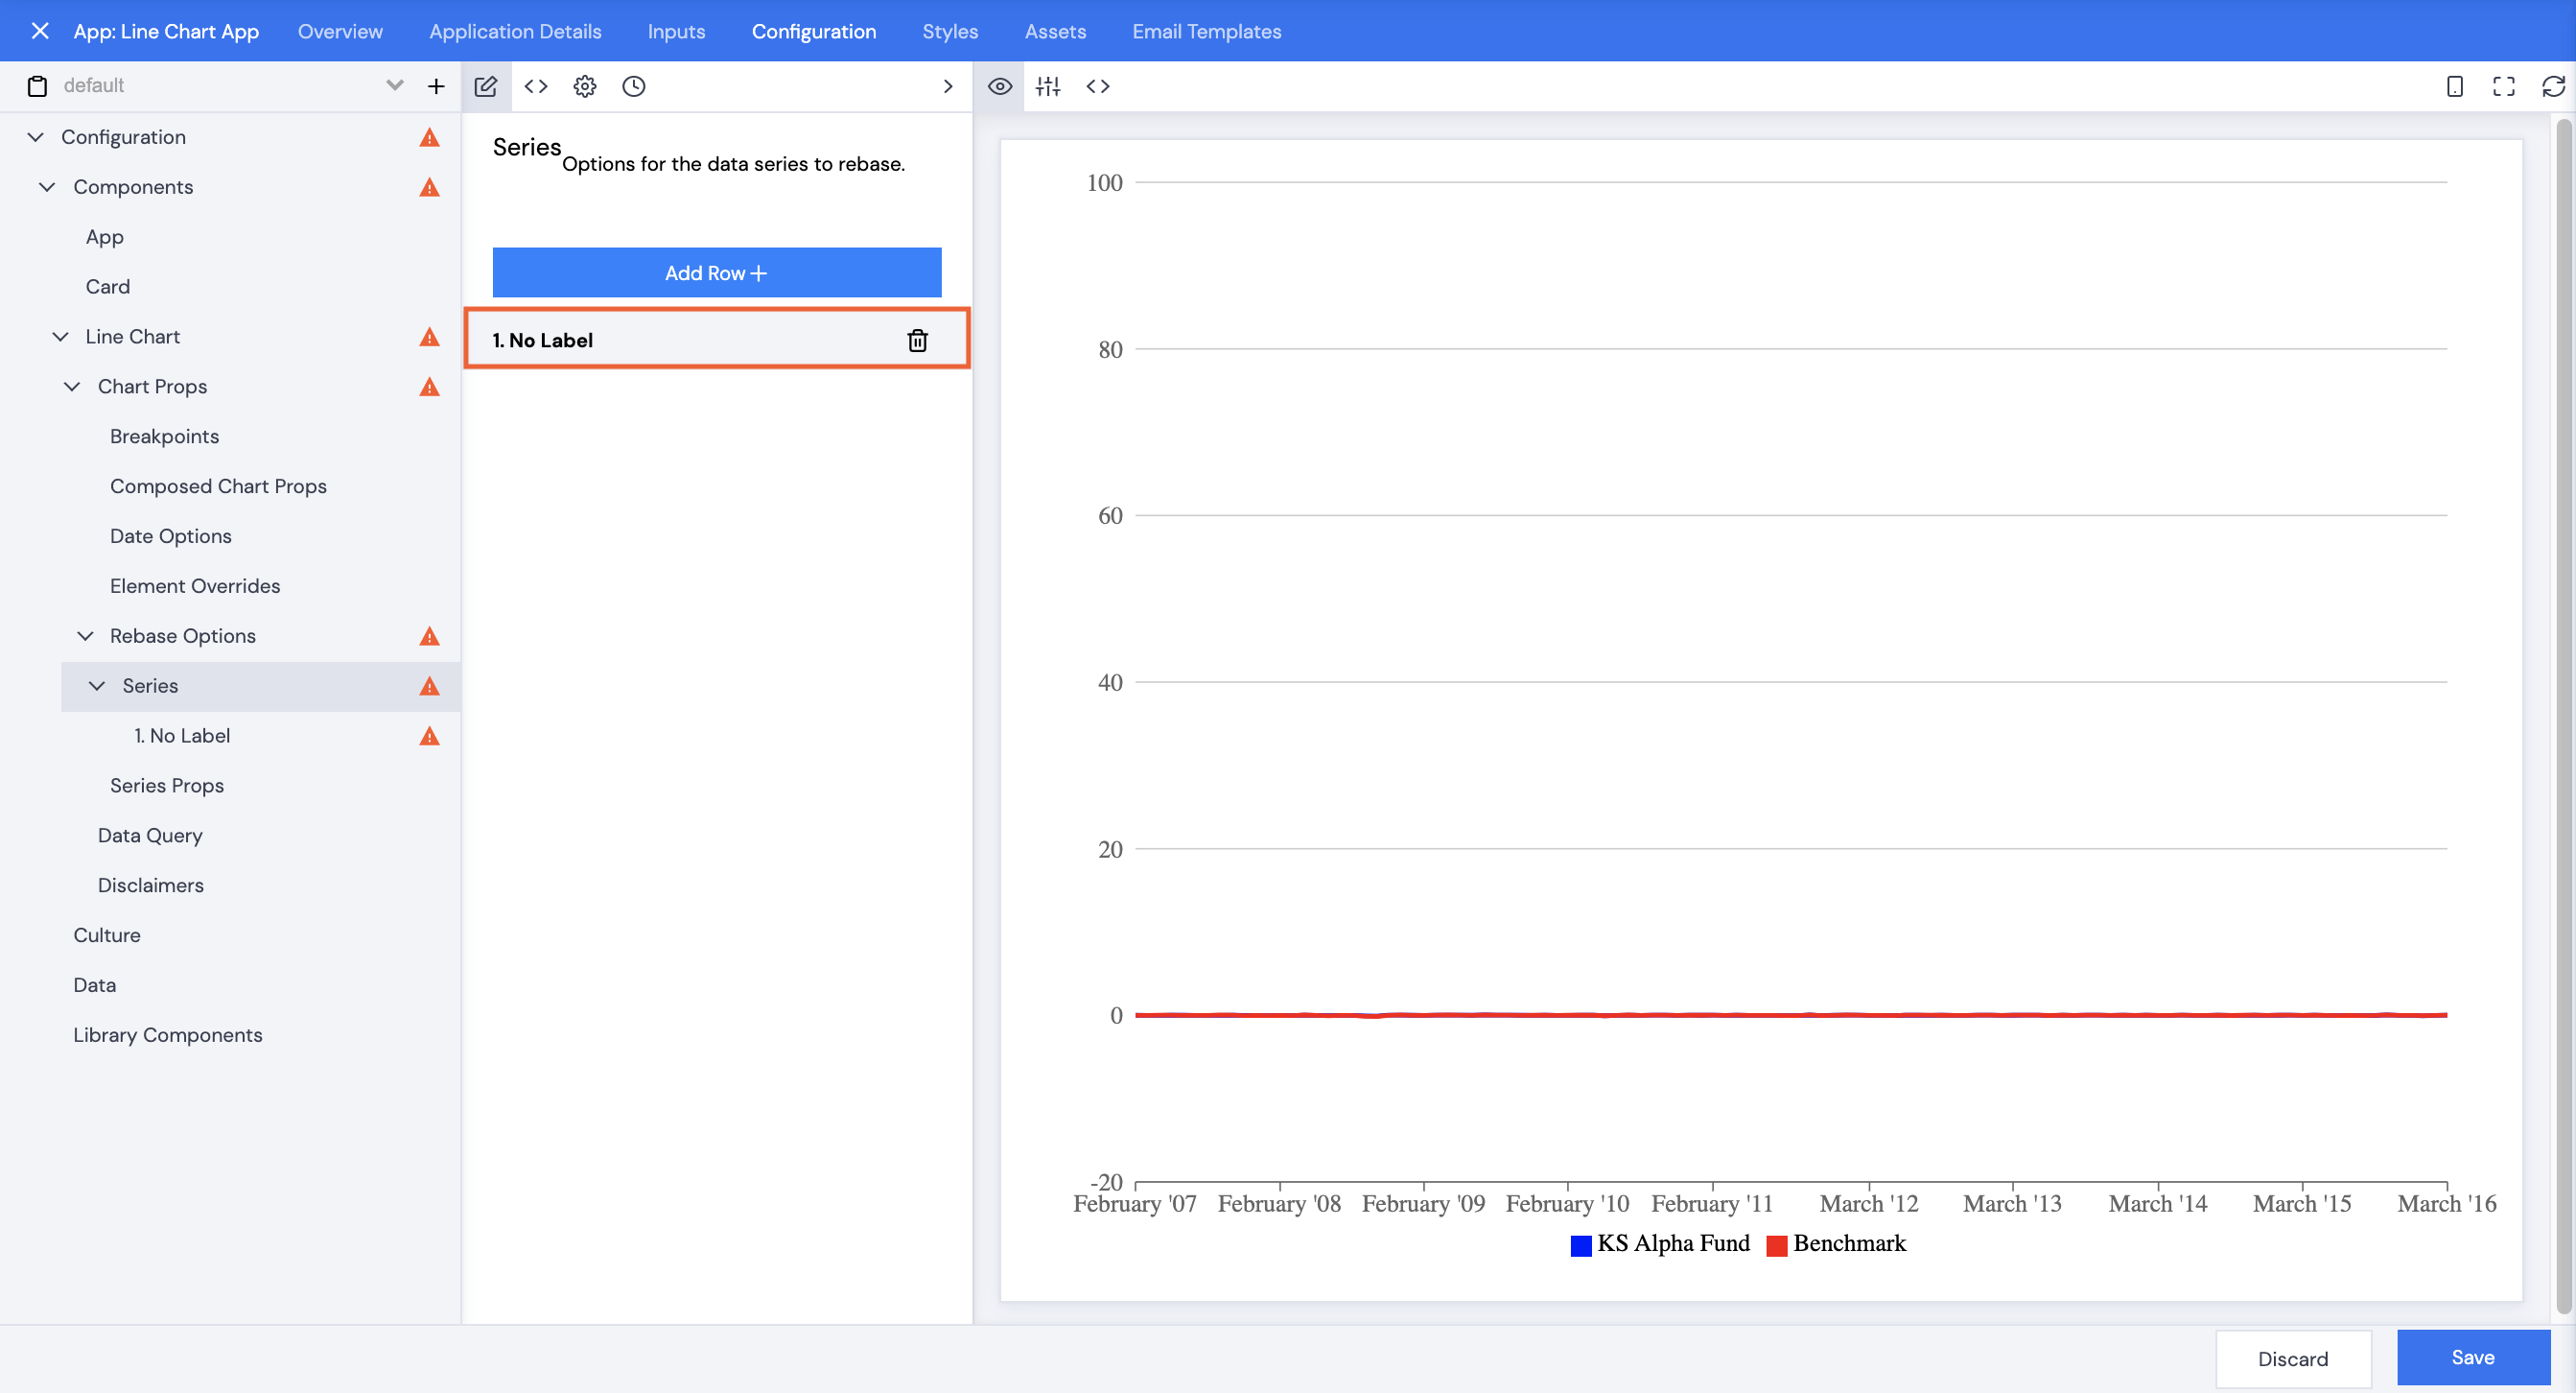
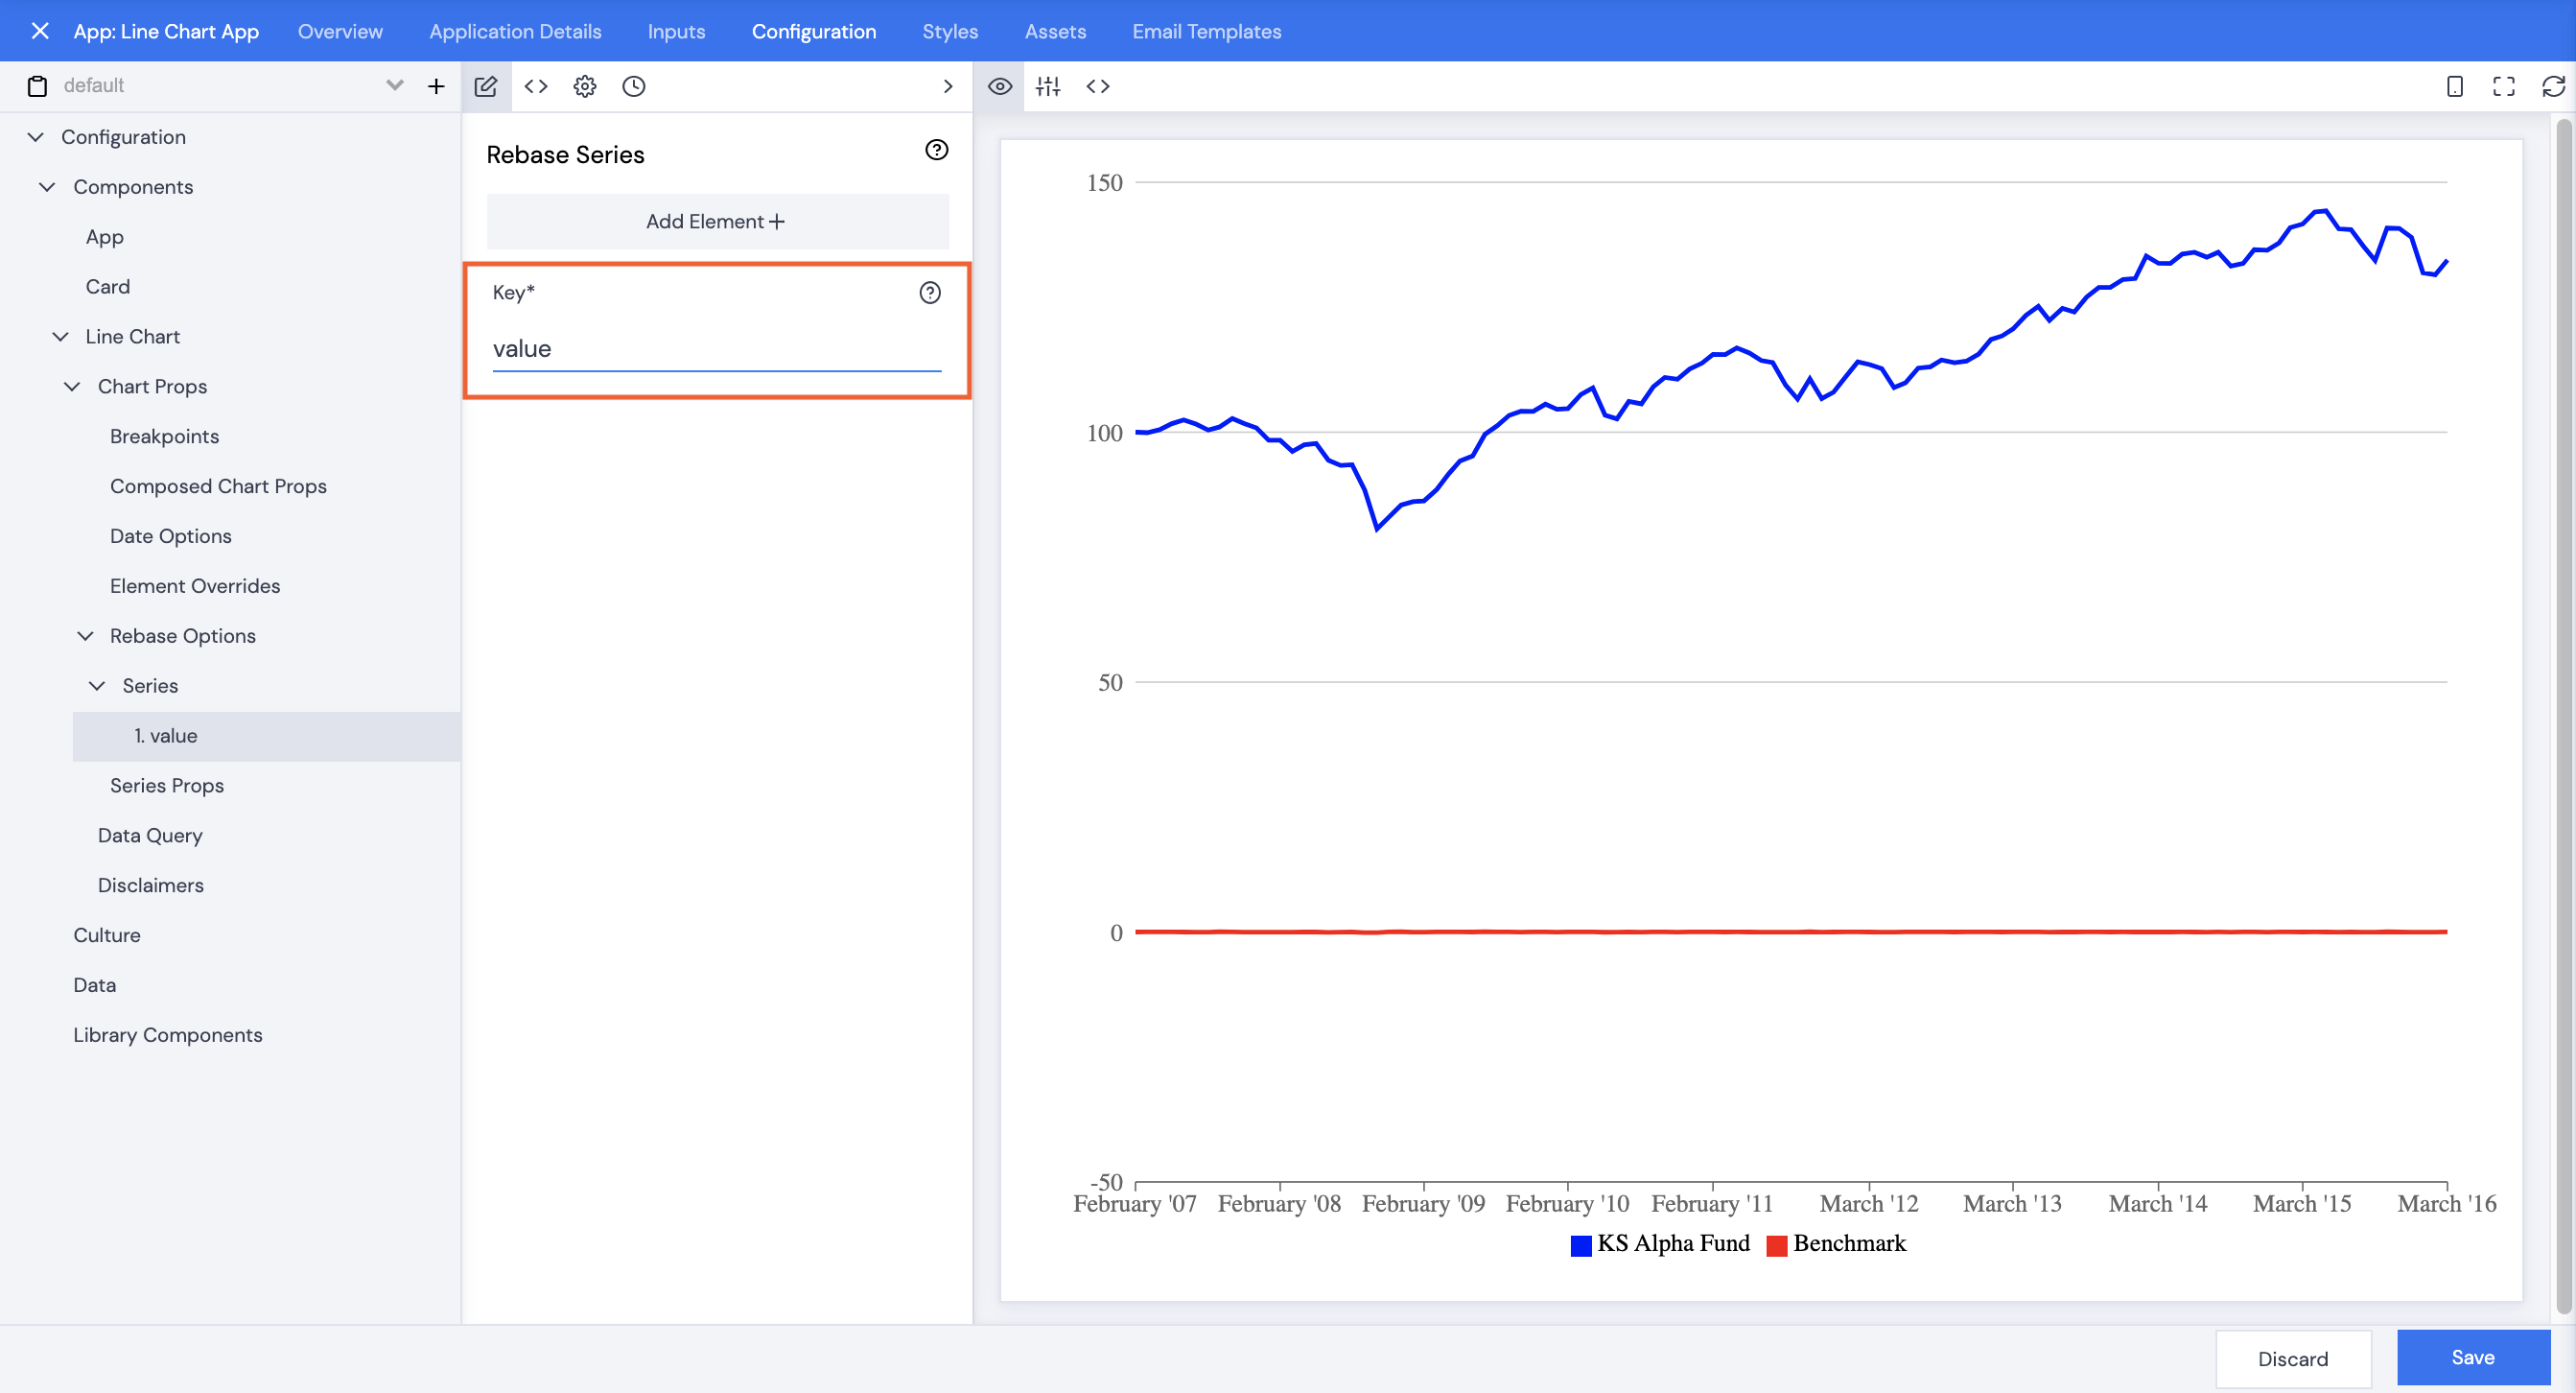
- Click 1.No Label.
- Type in the name of the Key – the key references the column header code of the Timeseries in the data table (as per the example above – value). The line chart will update immediately.
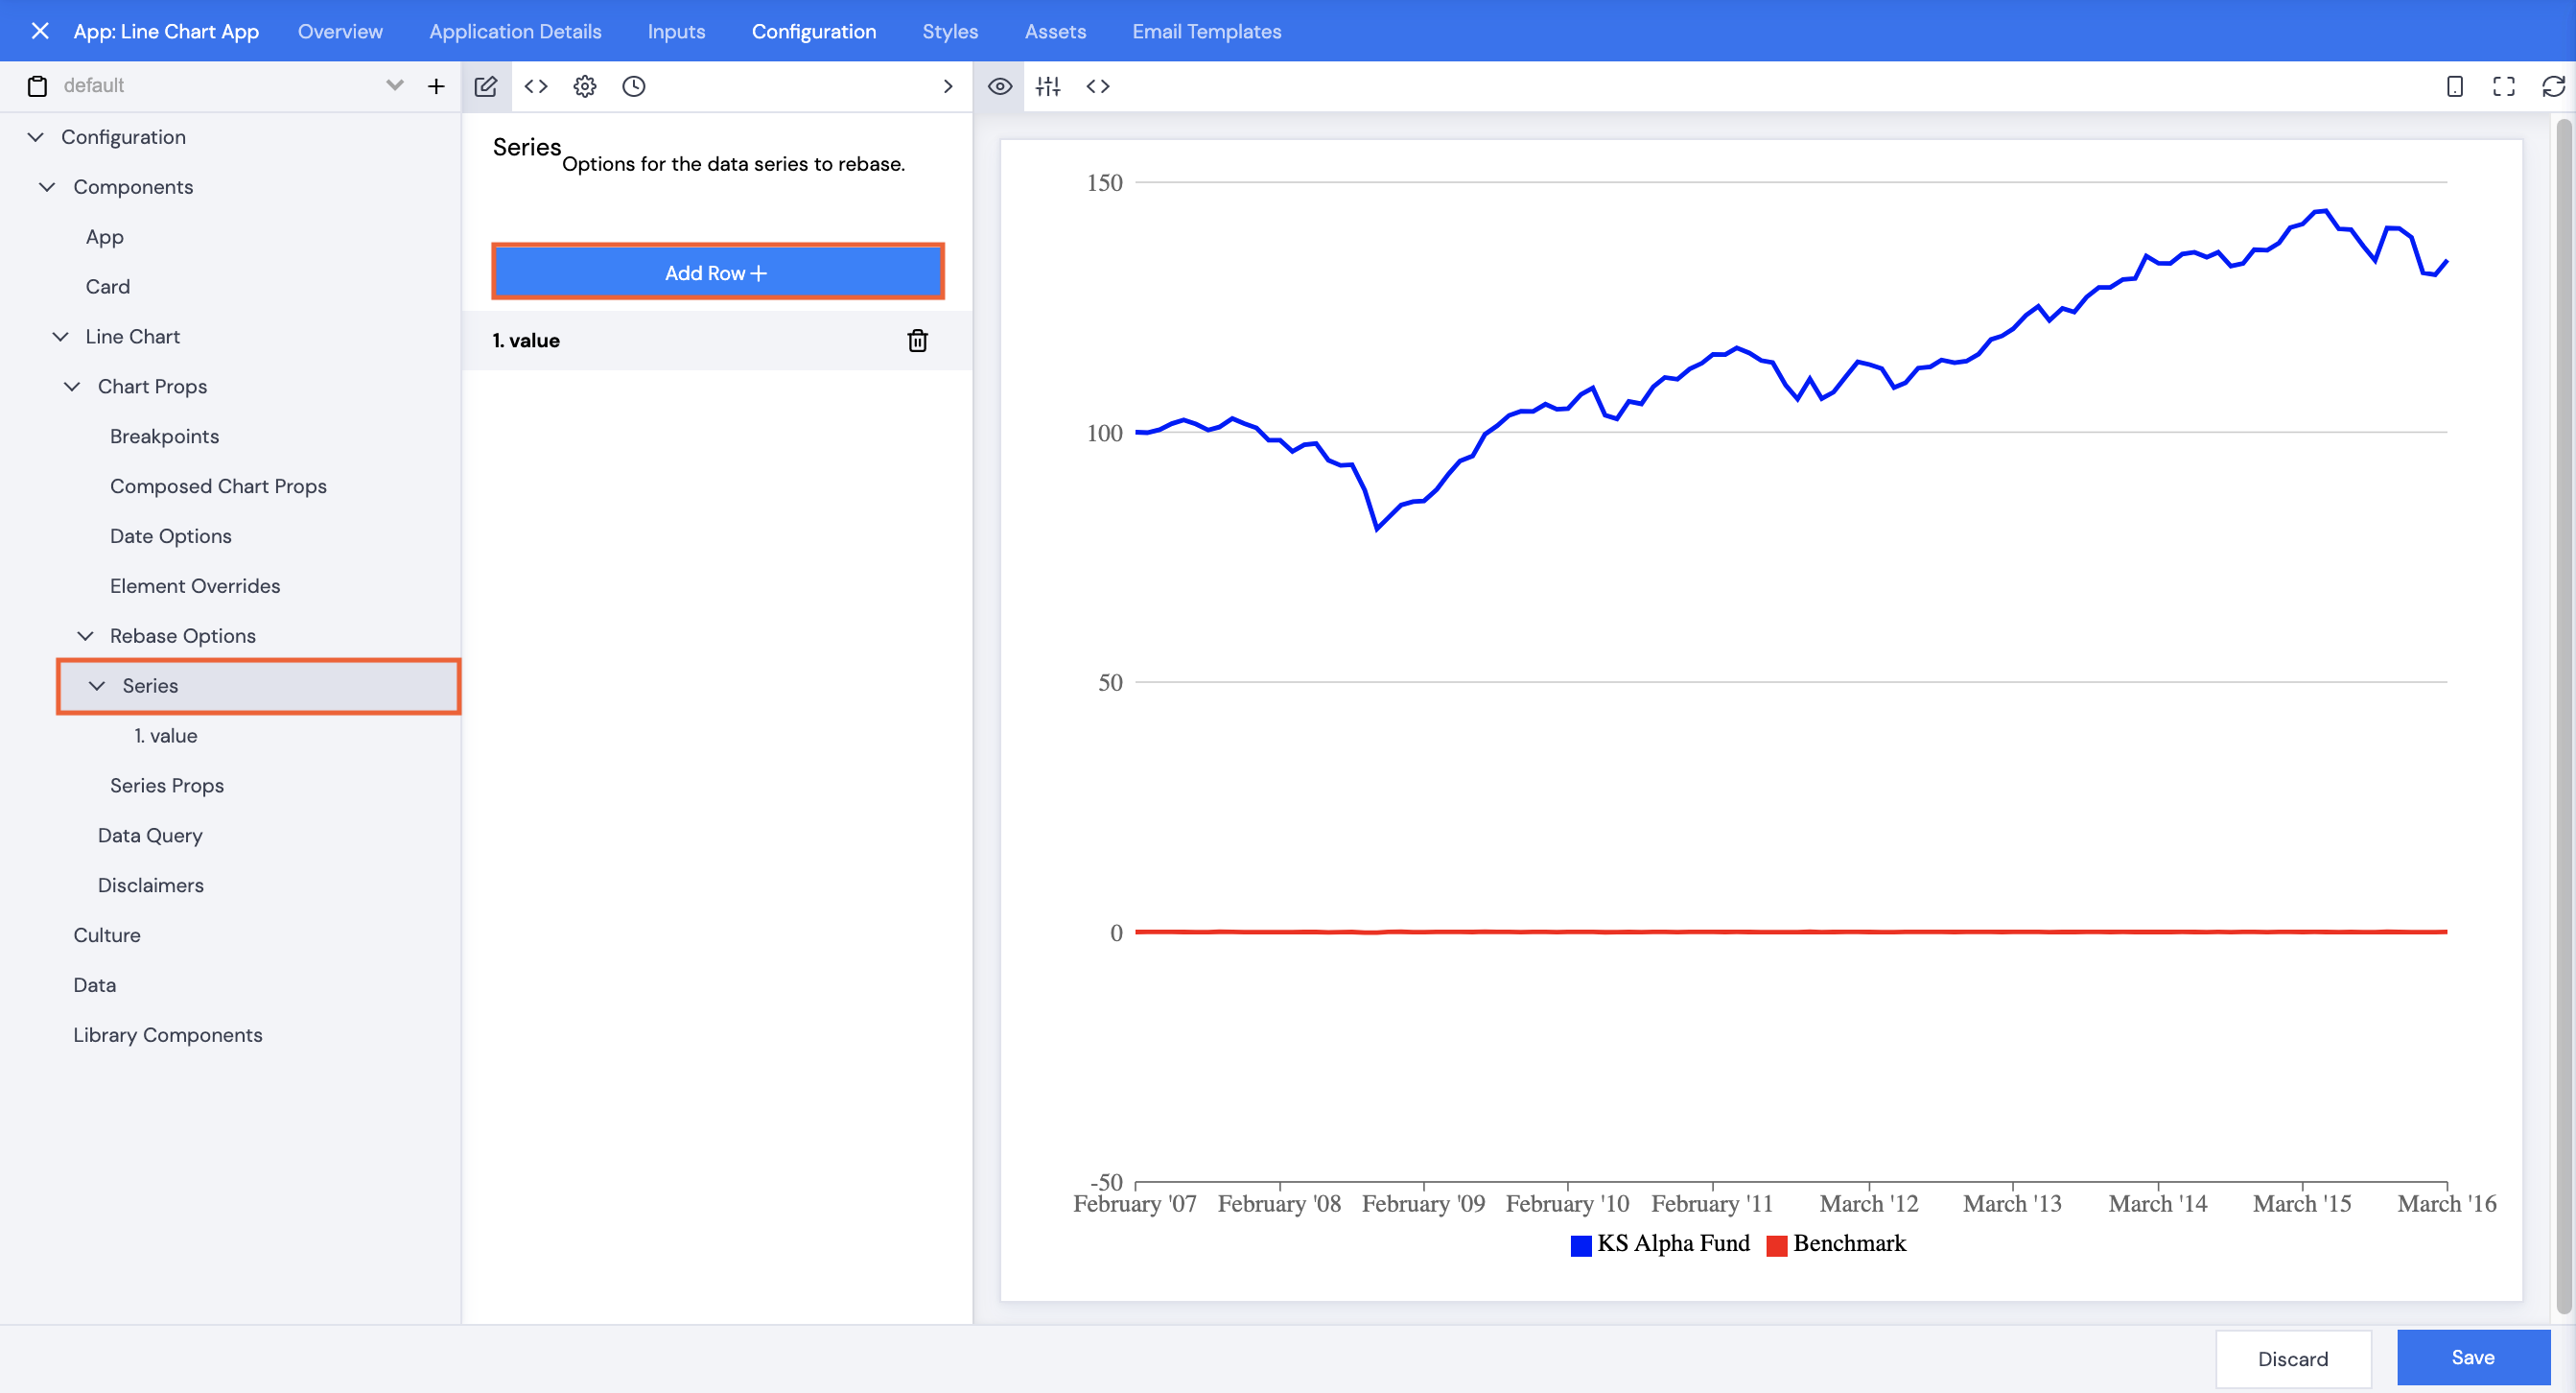
- To apply rebasing to the Benchmark, click back to Series, then click Add Row+.
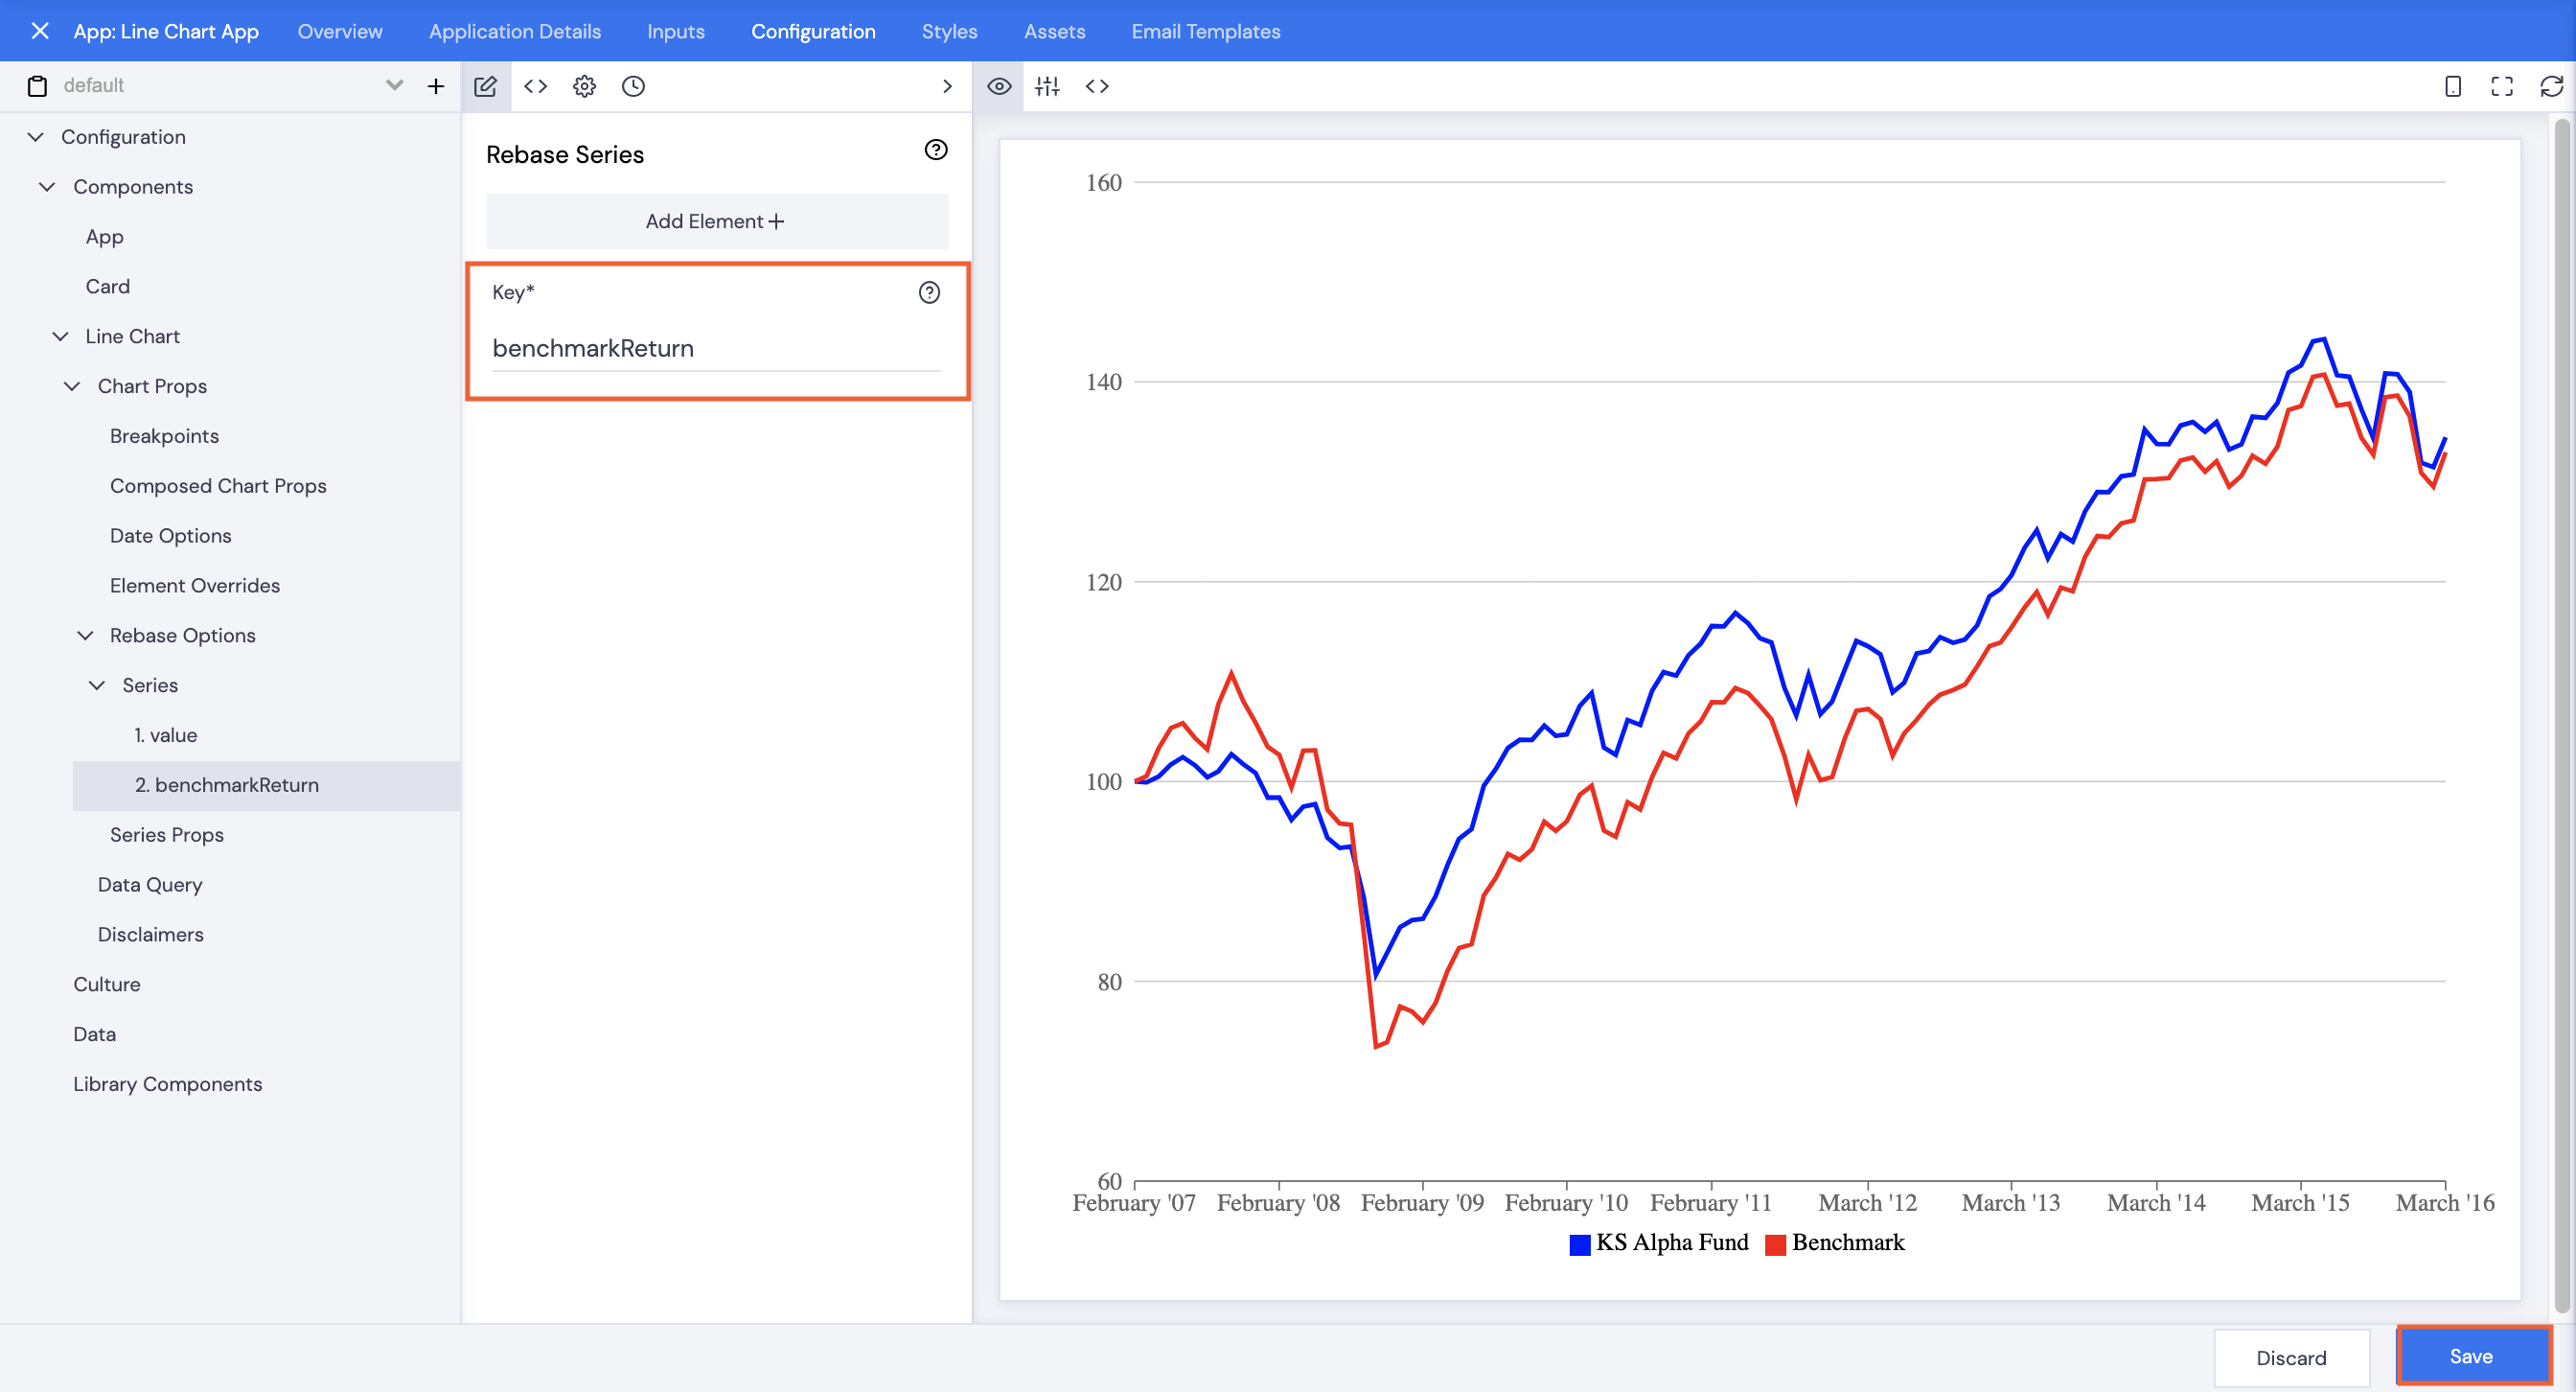
- Click 2.No Label.
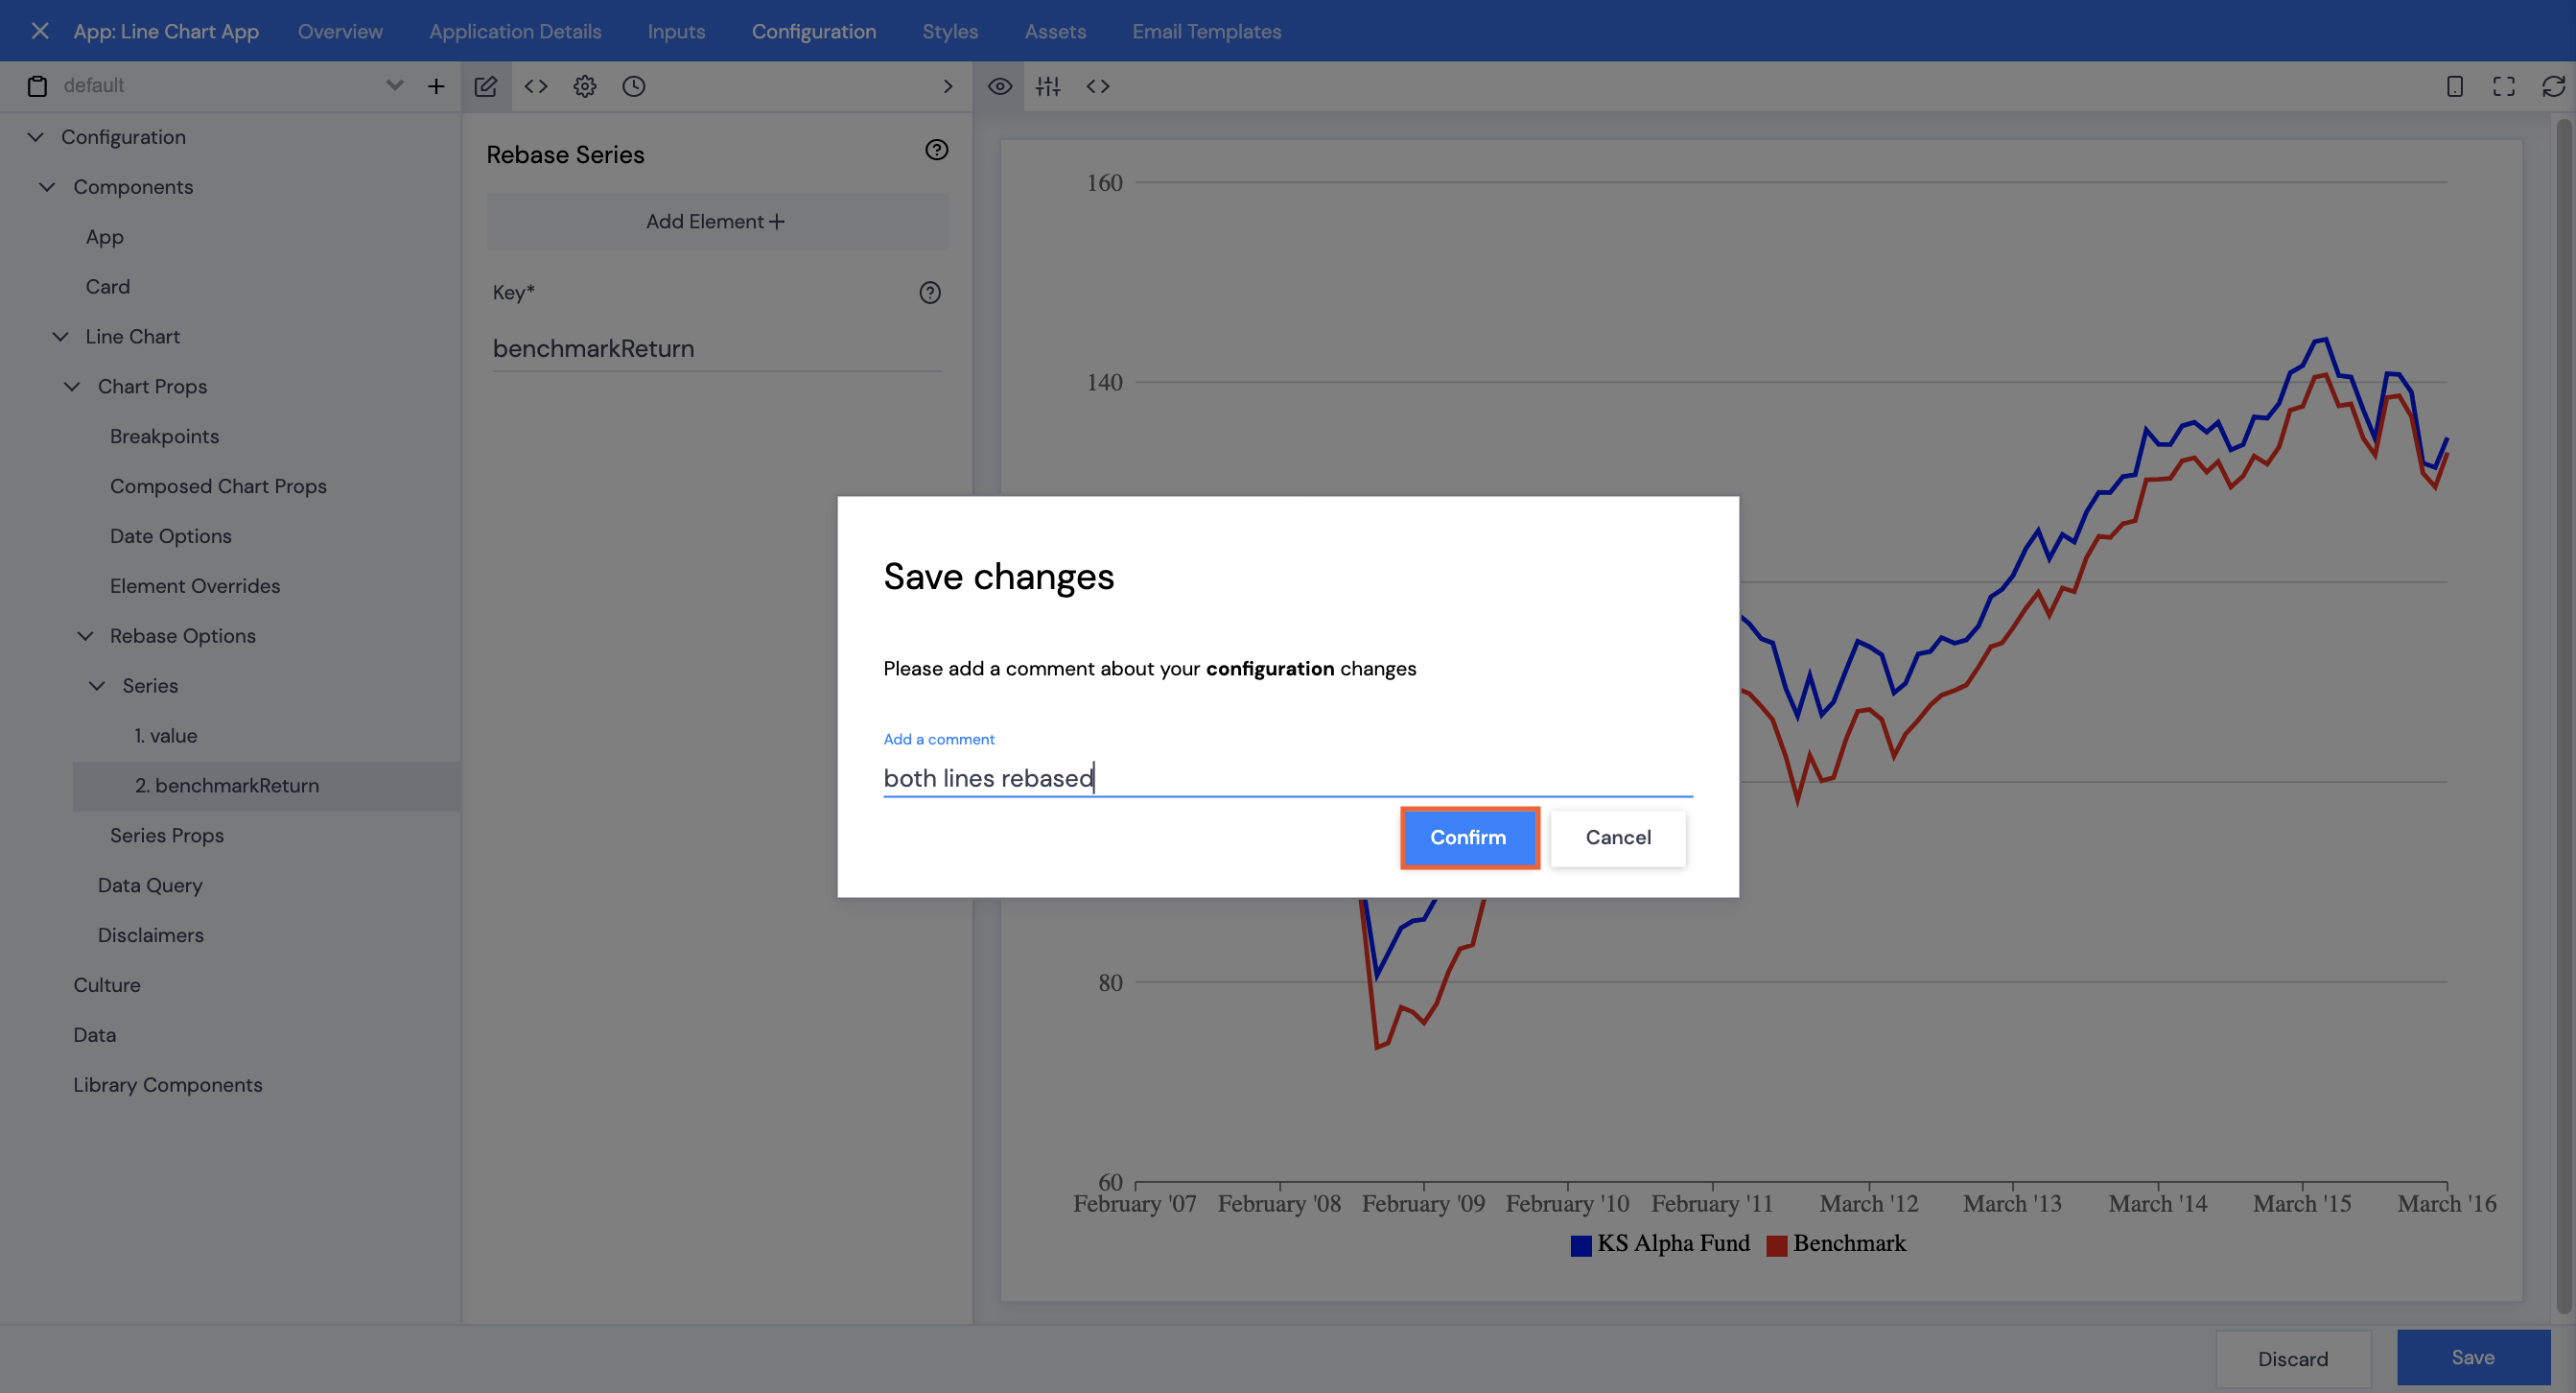
- Type in the Key for the Benchmark line – in this example benchmarkReturn. The line chart will update immediately.
- Click Save.
- Type in a comment, then click Confirm.
Note: Both lines now start at the same value on the y-axis.
Styling can also be applied to the Line Chart.