
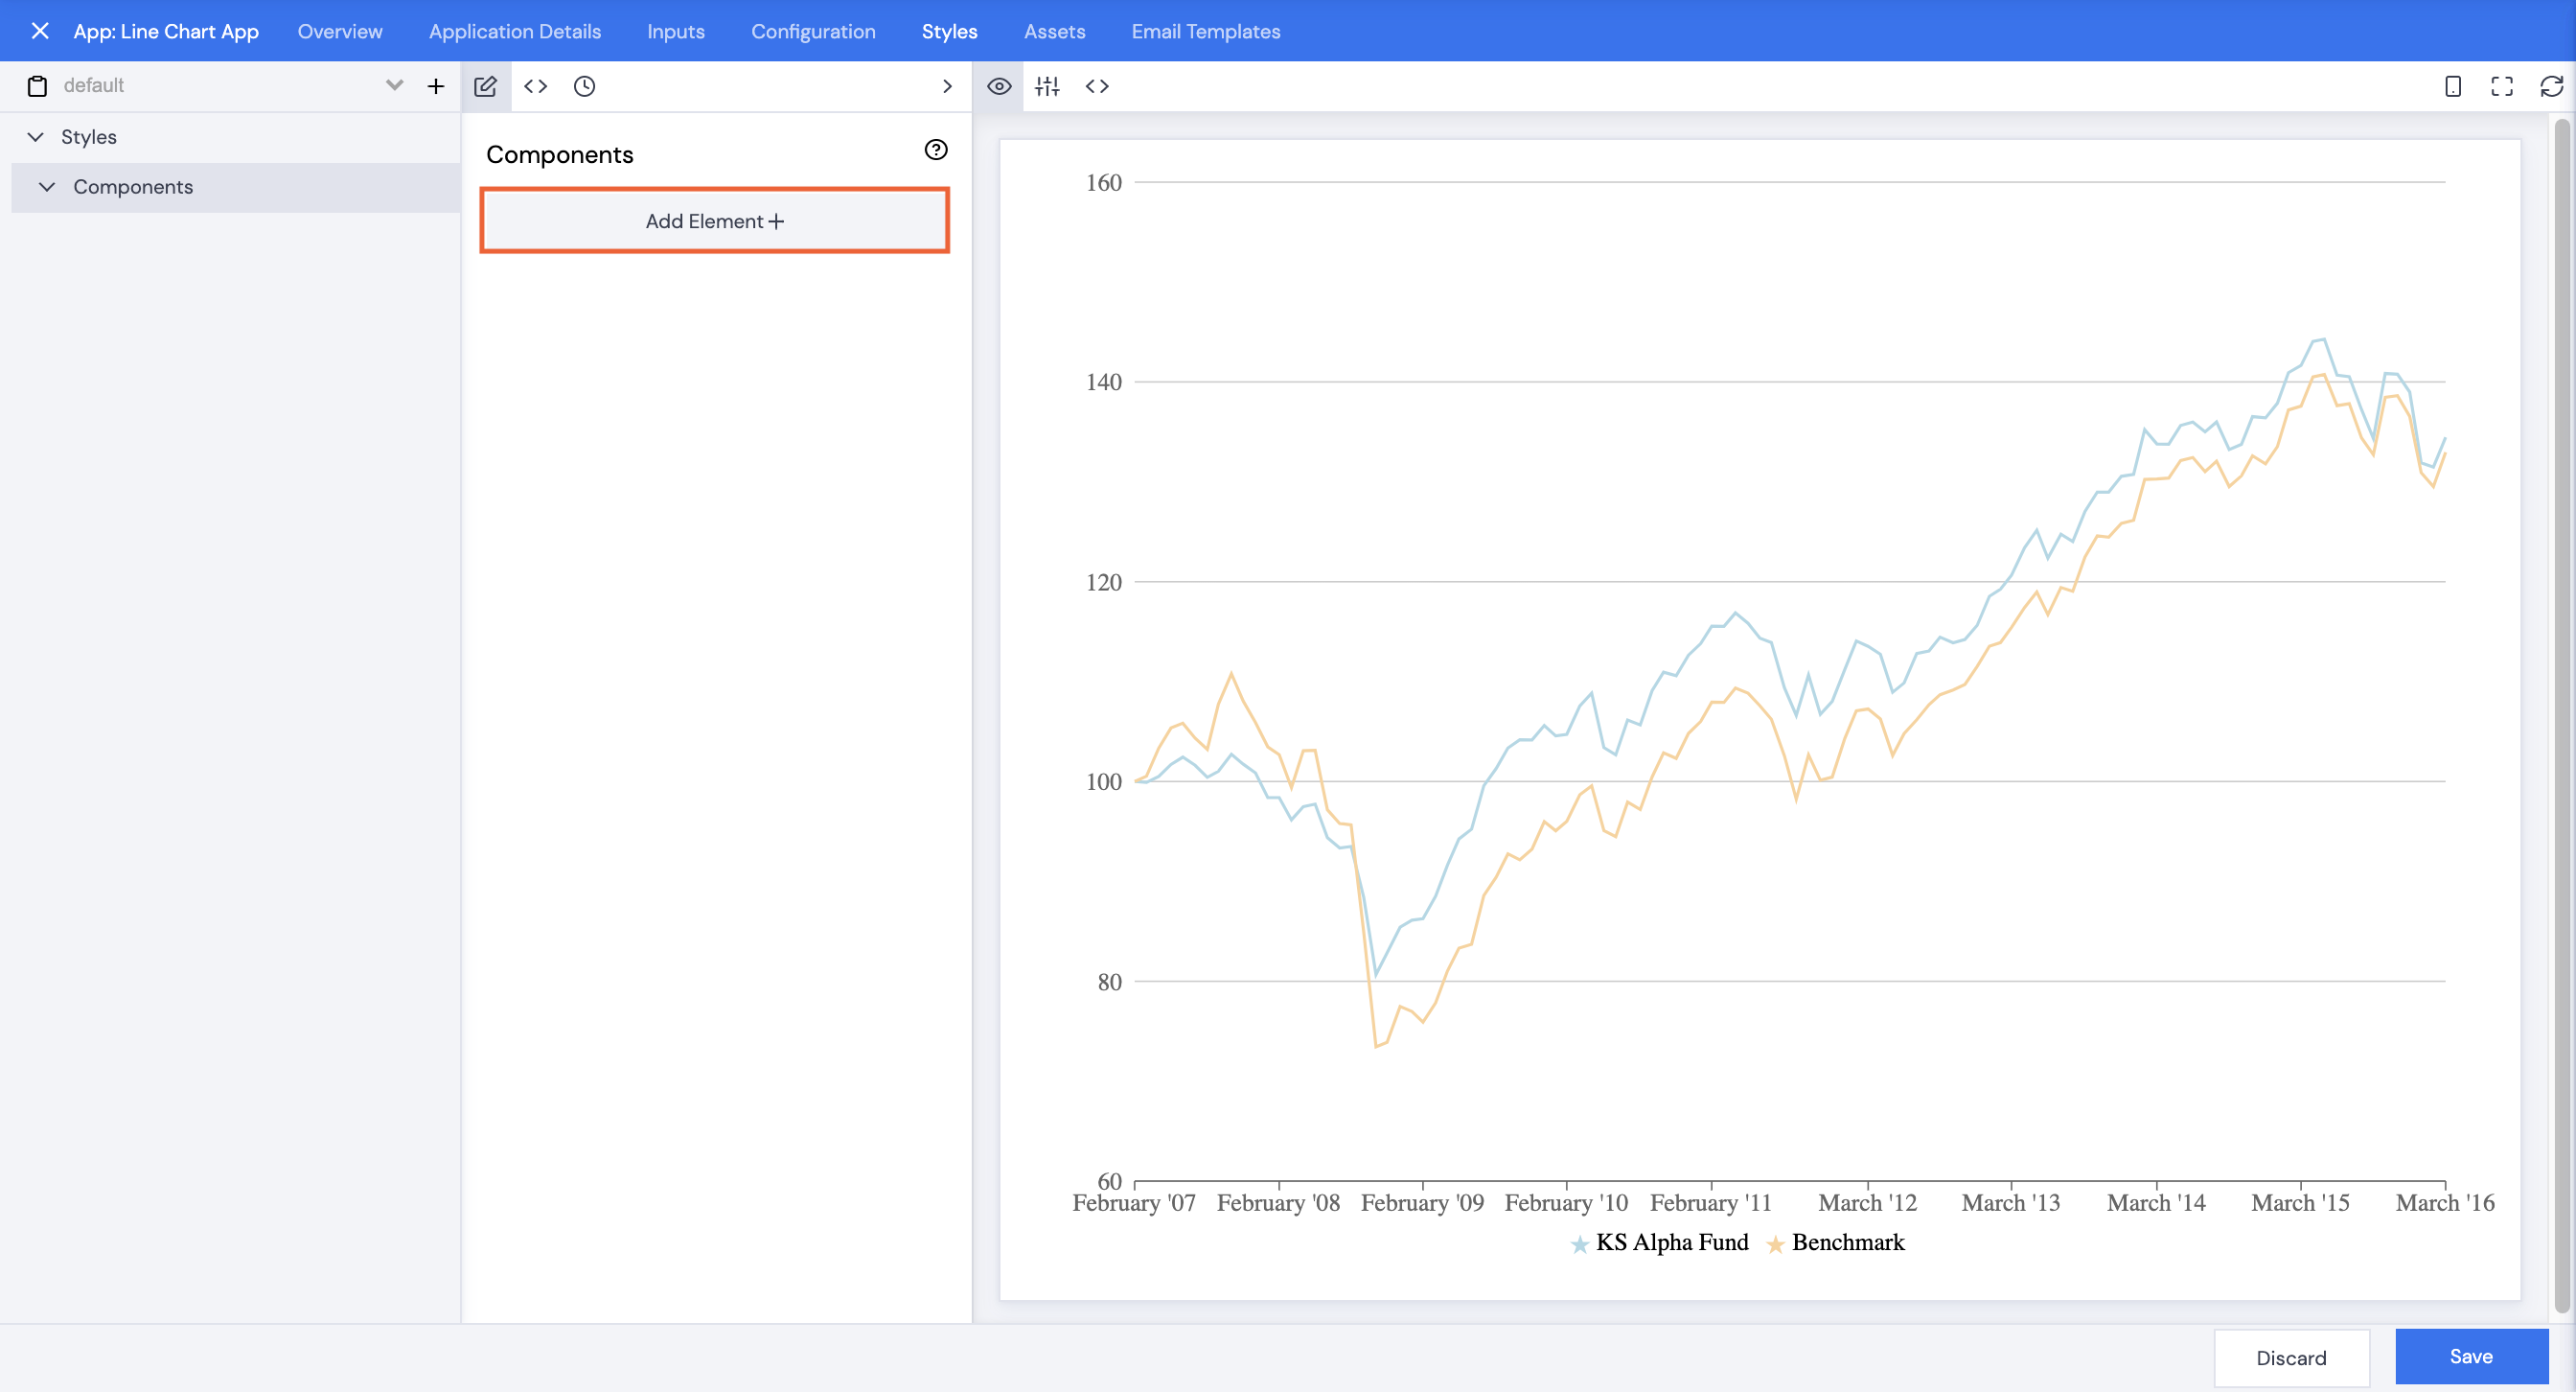
After creating your line chart app, you can amend the Line Chart styles. Most styling is done under the Configuration tab, but fonts are edited under the Styles tab.
Table of Contents
Line Color & Weight
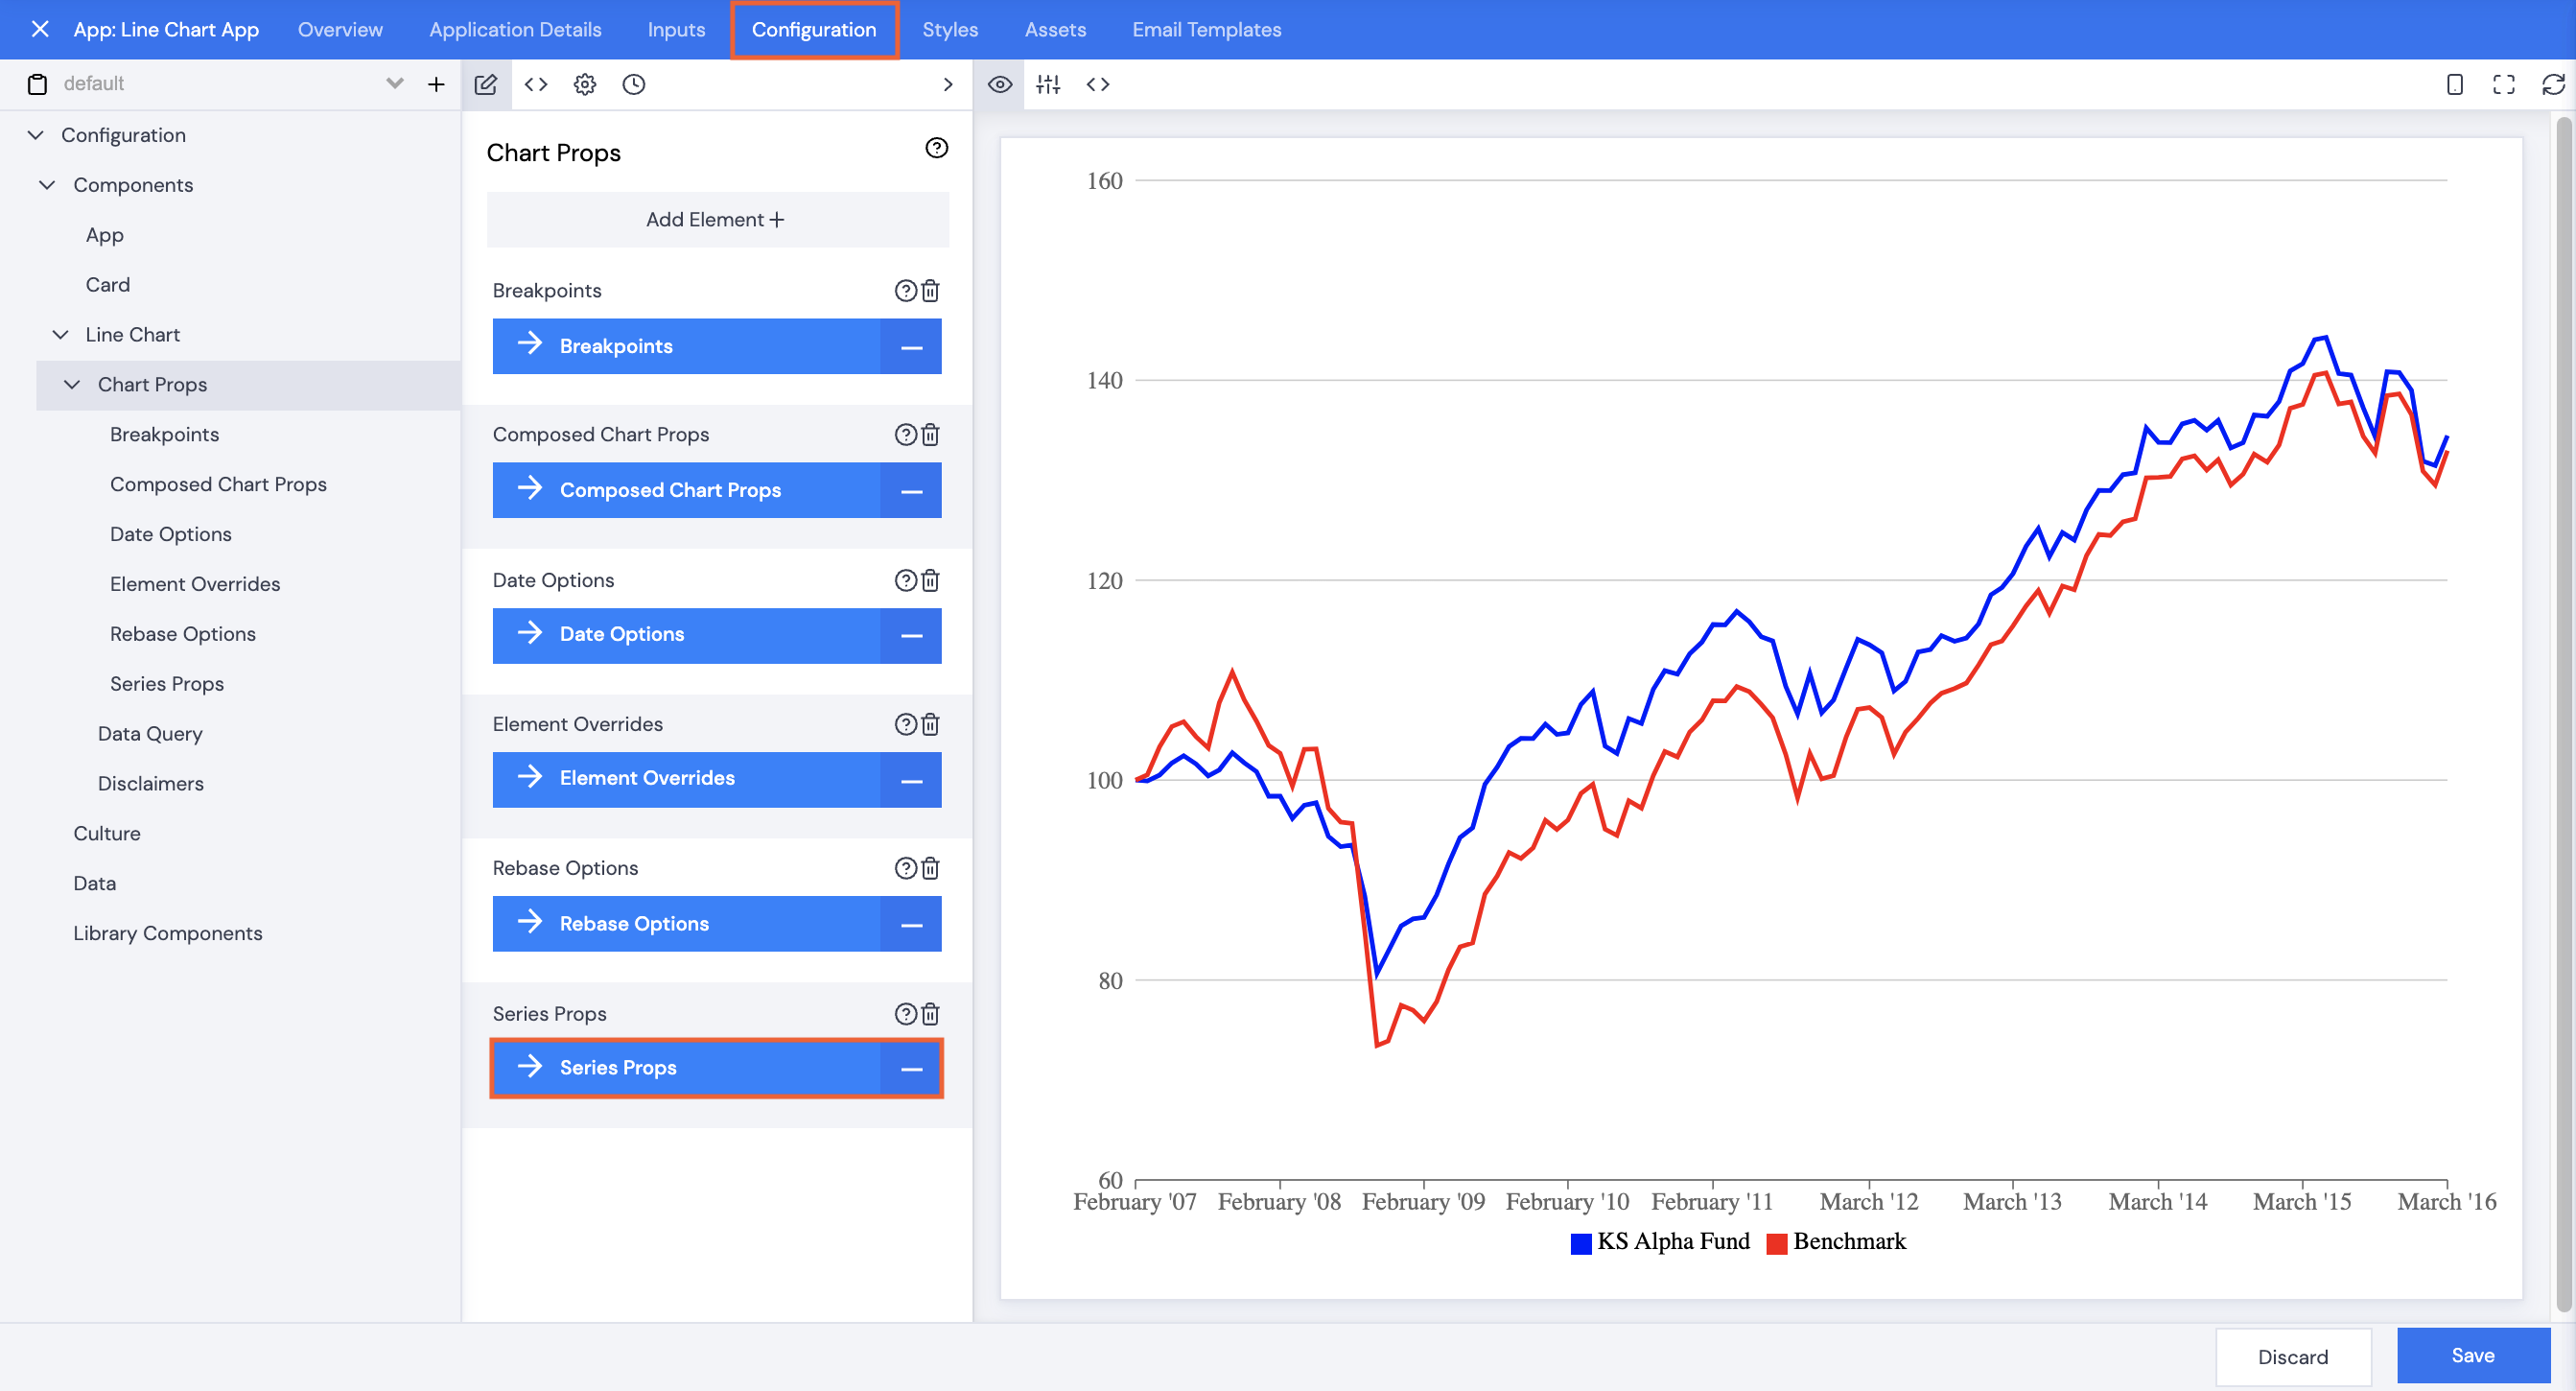
- Click Configuration.
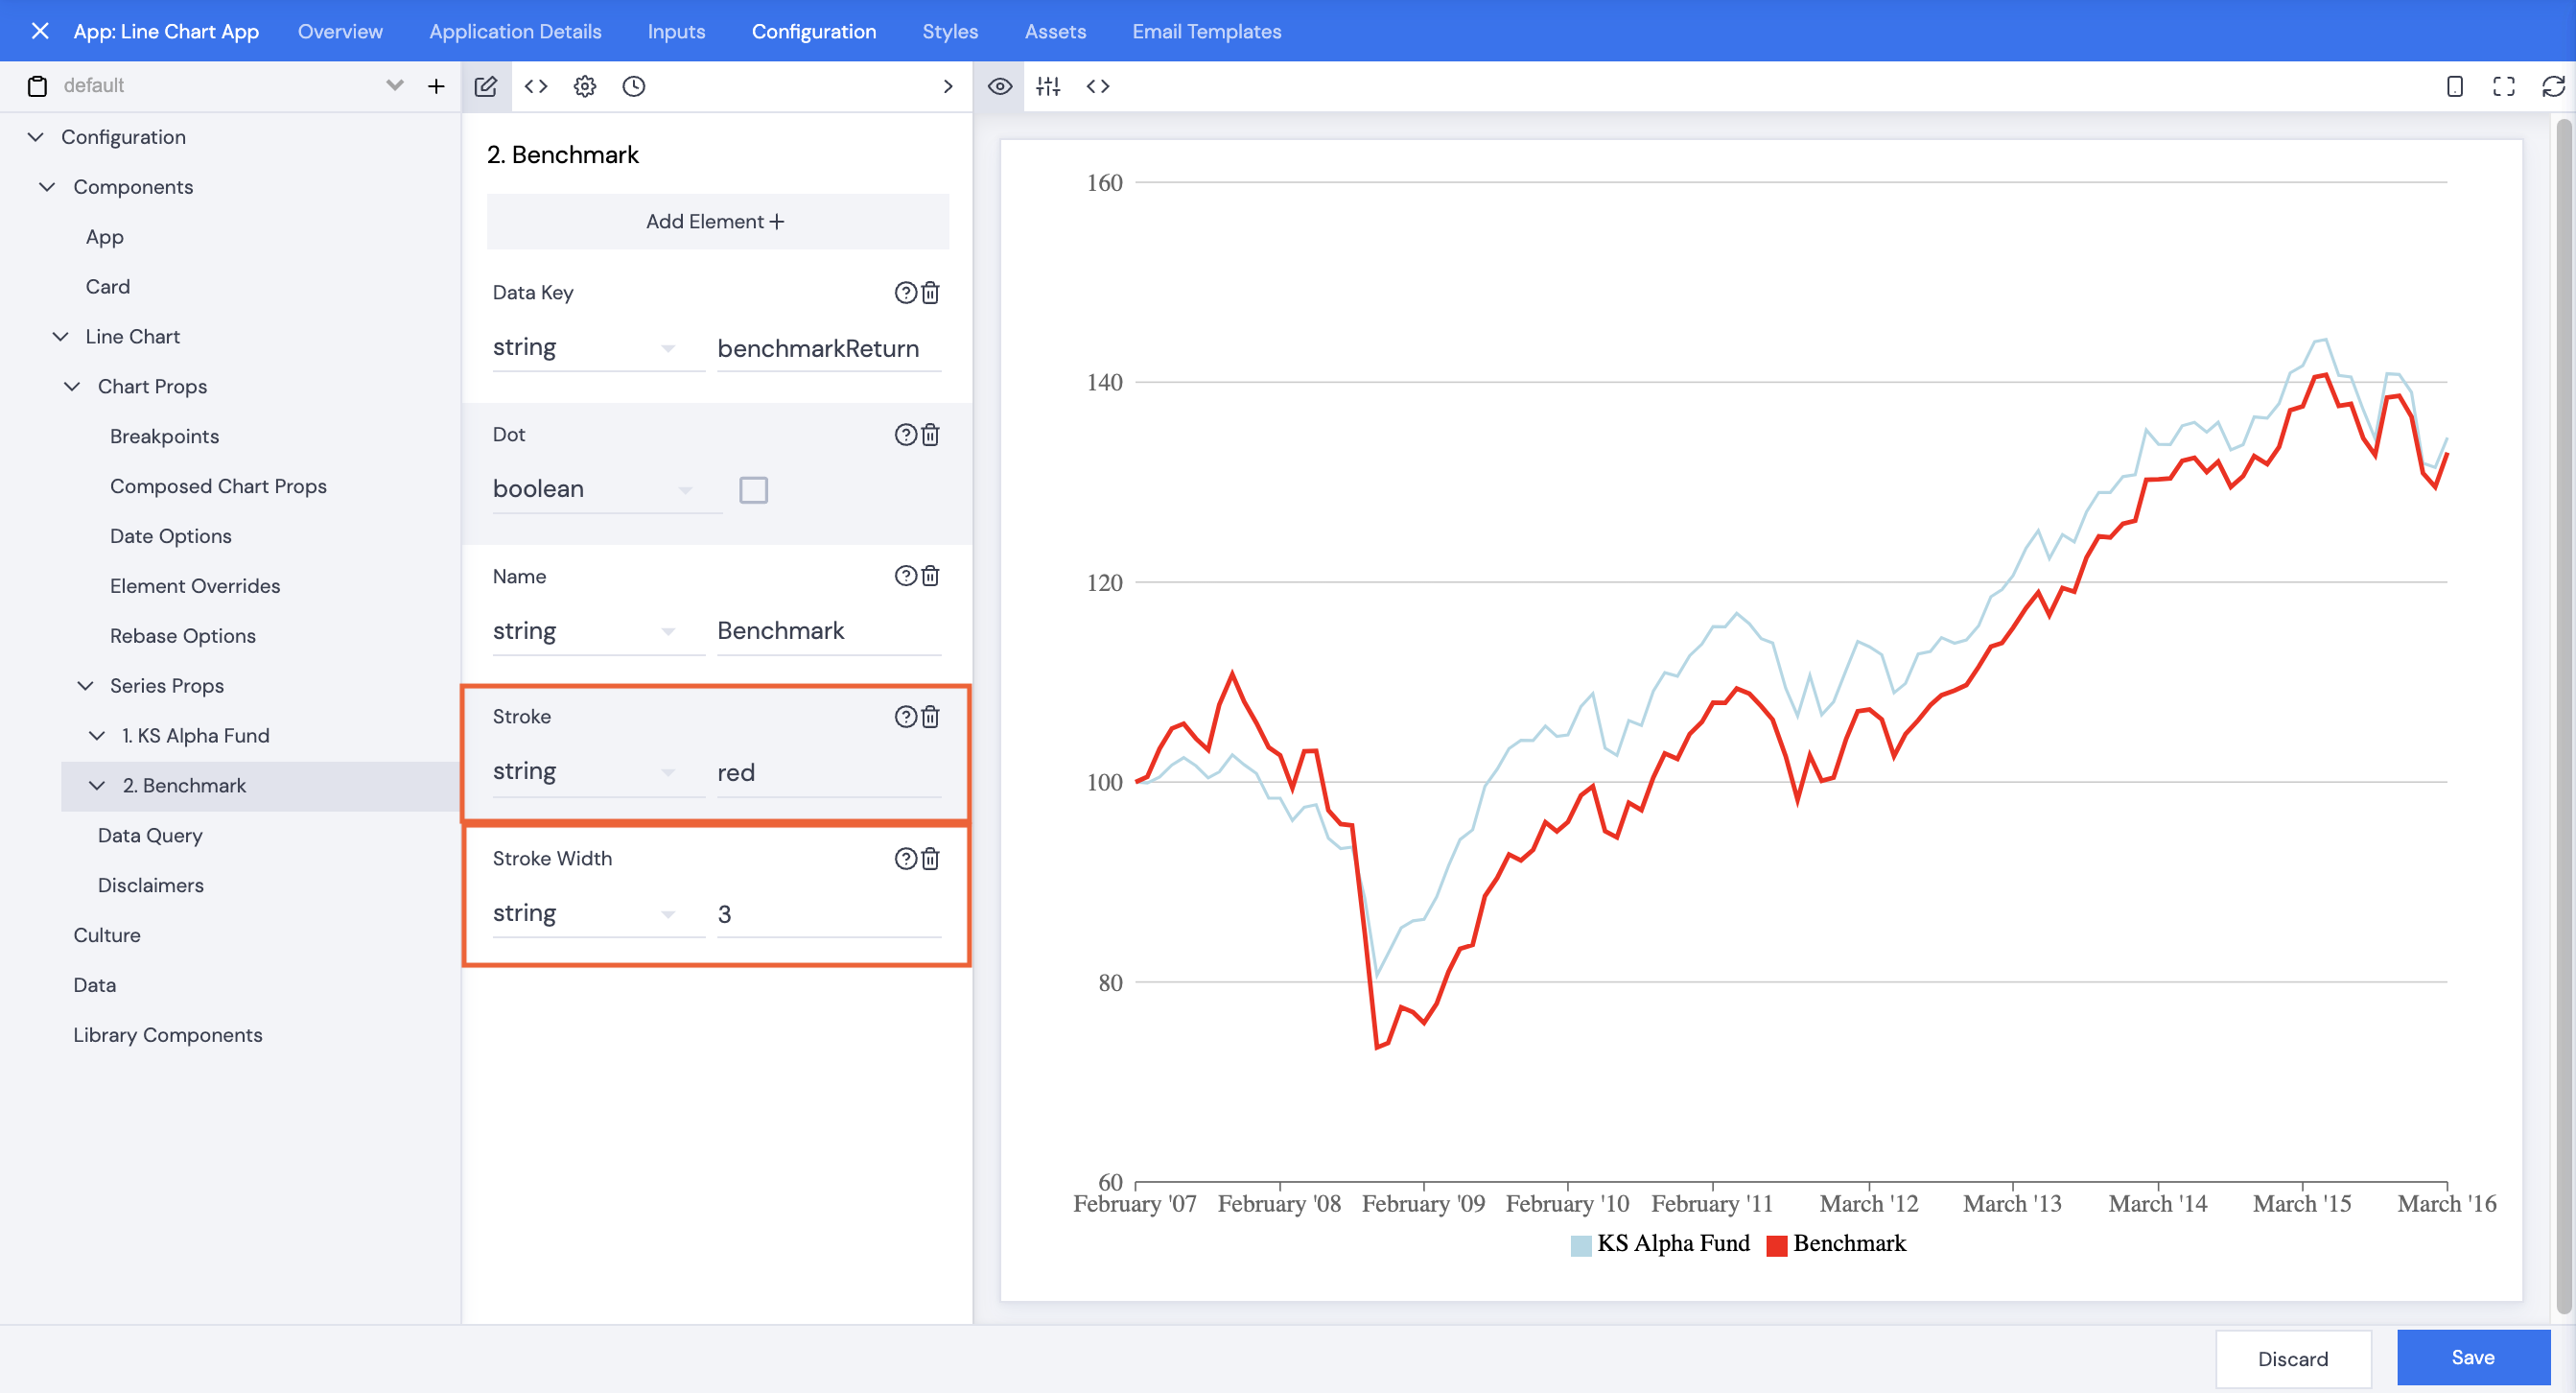
- Browse to Components | Line Chart | Chart Props, then click Series Props.
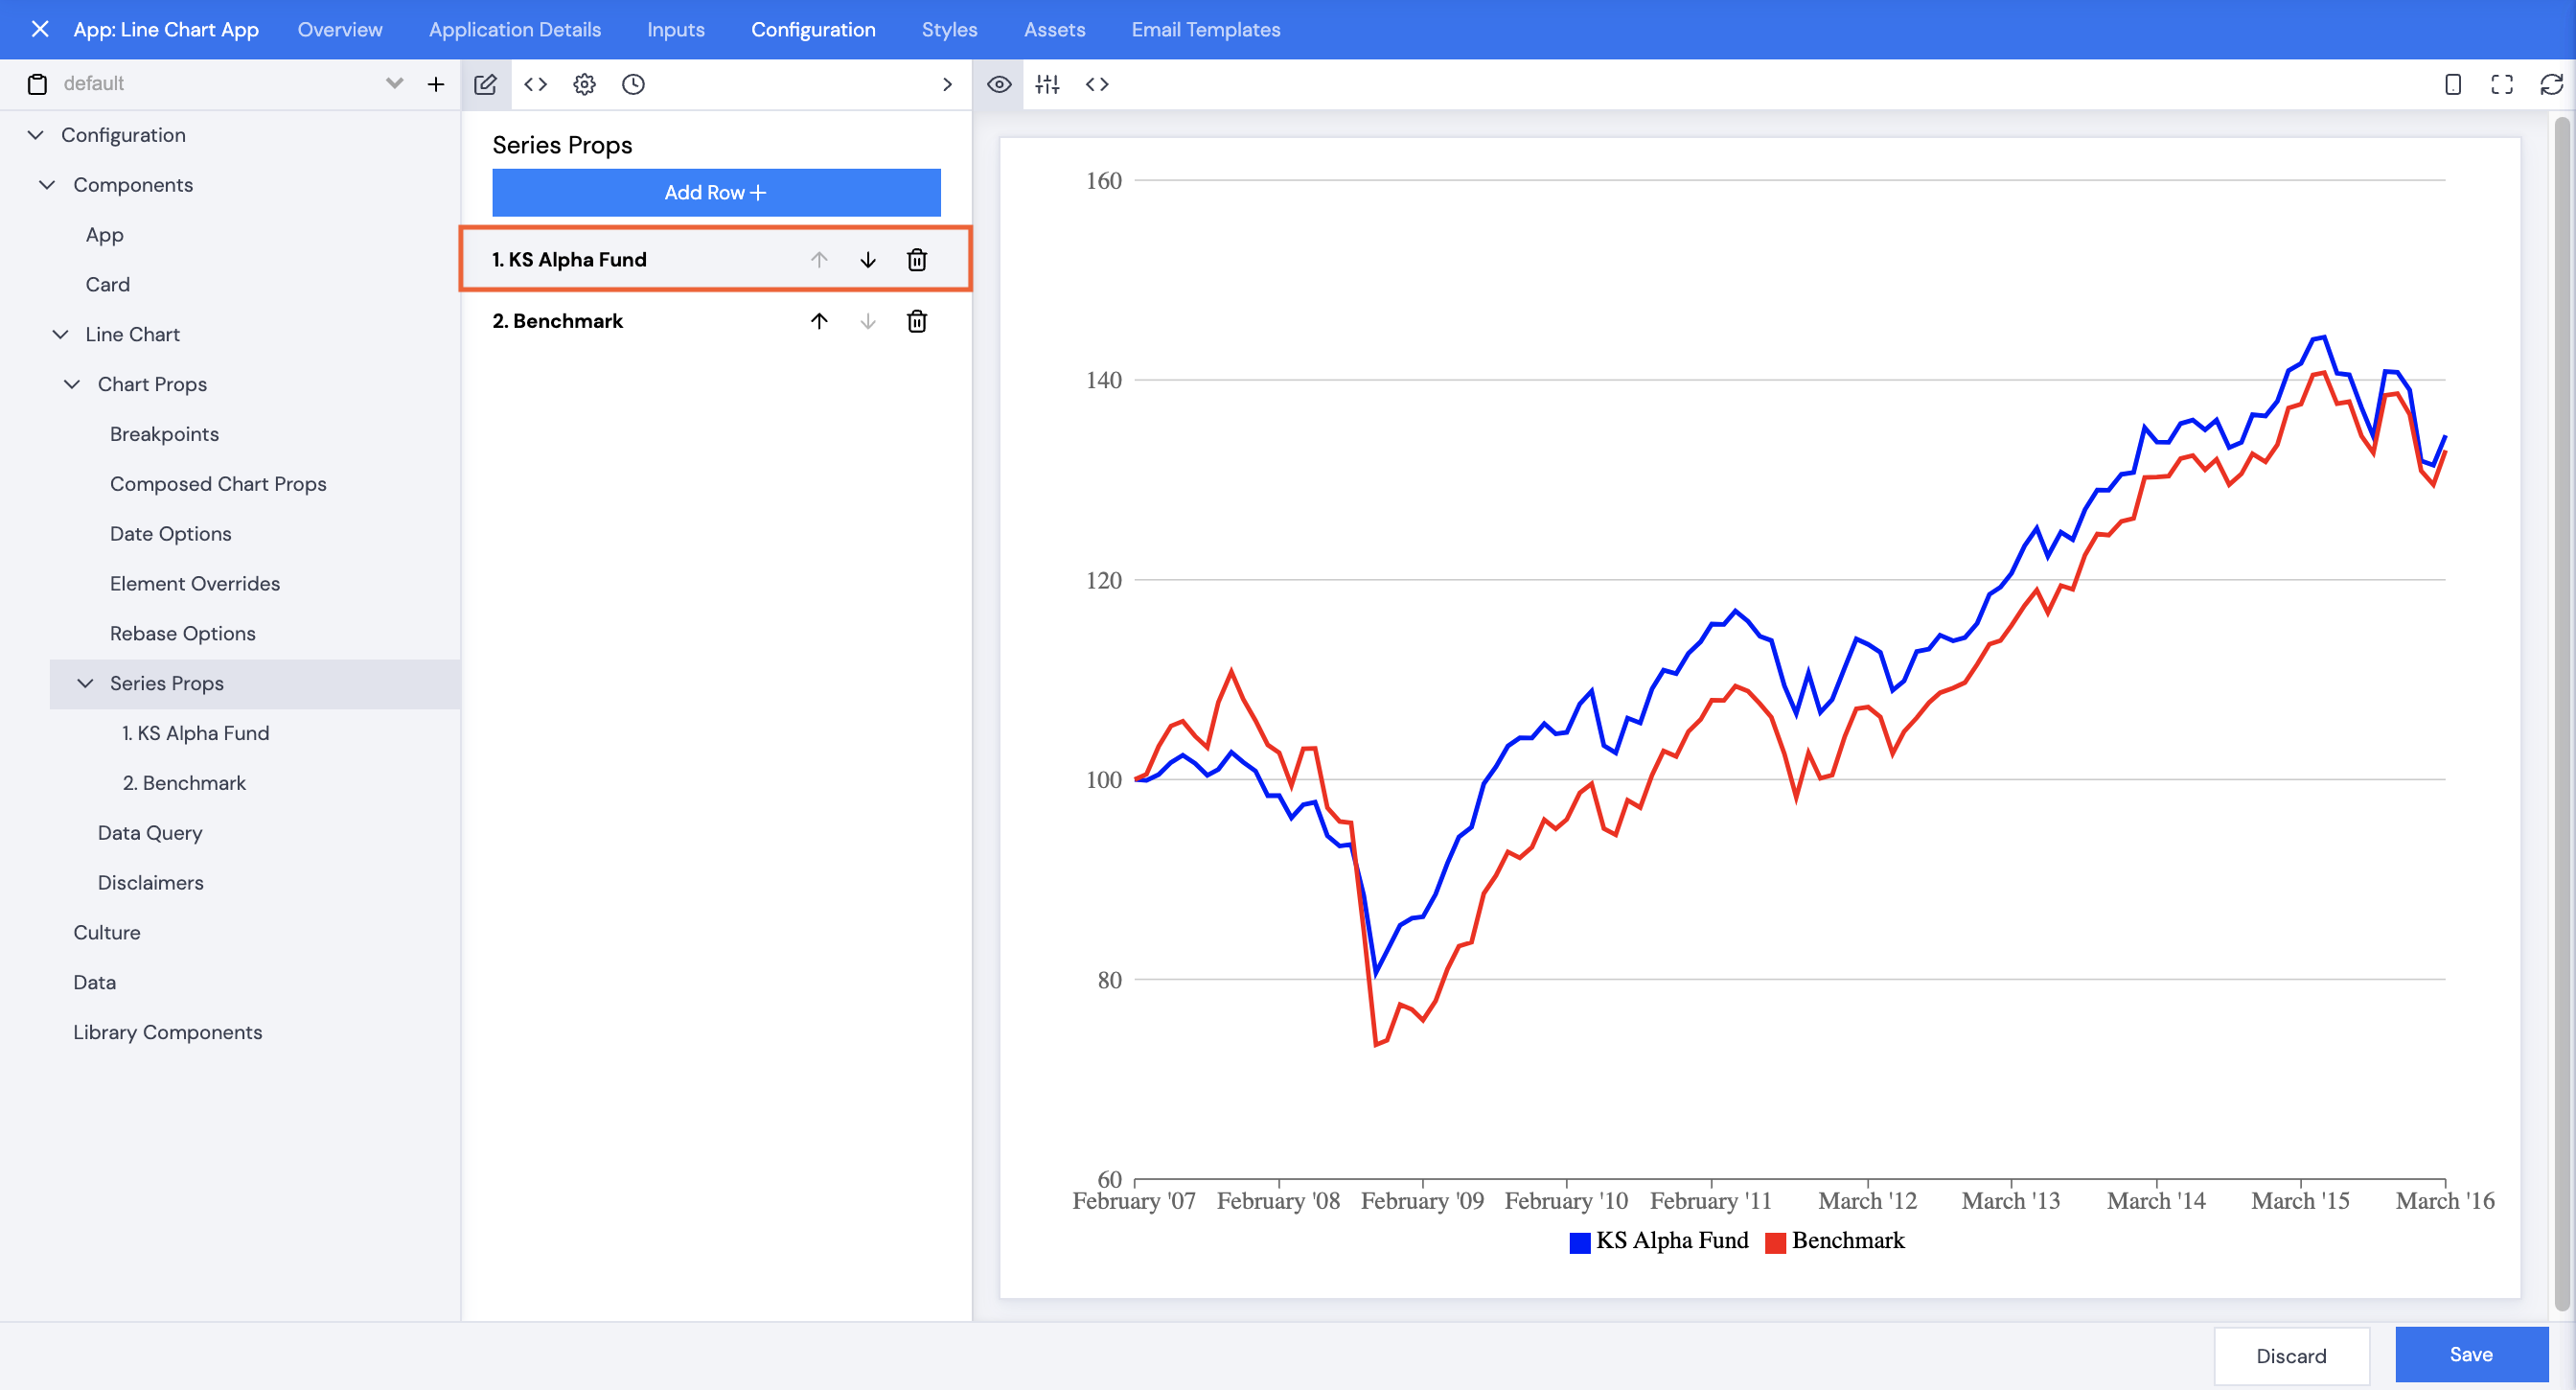
- Click one of the options under Series Props, e.g. KS Alpha Fund.
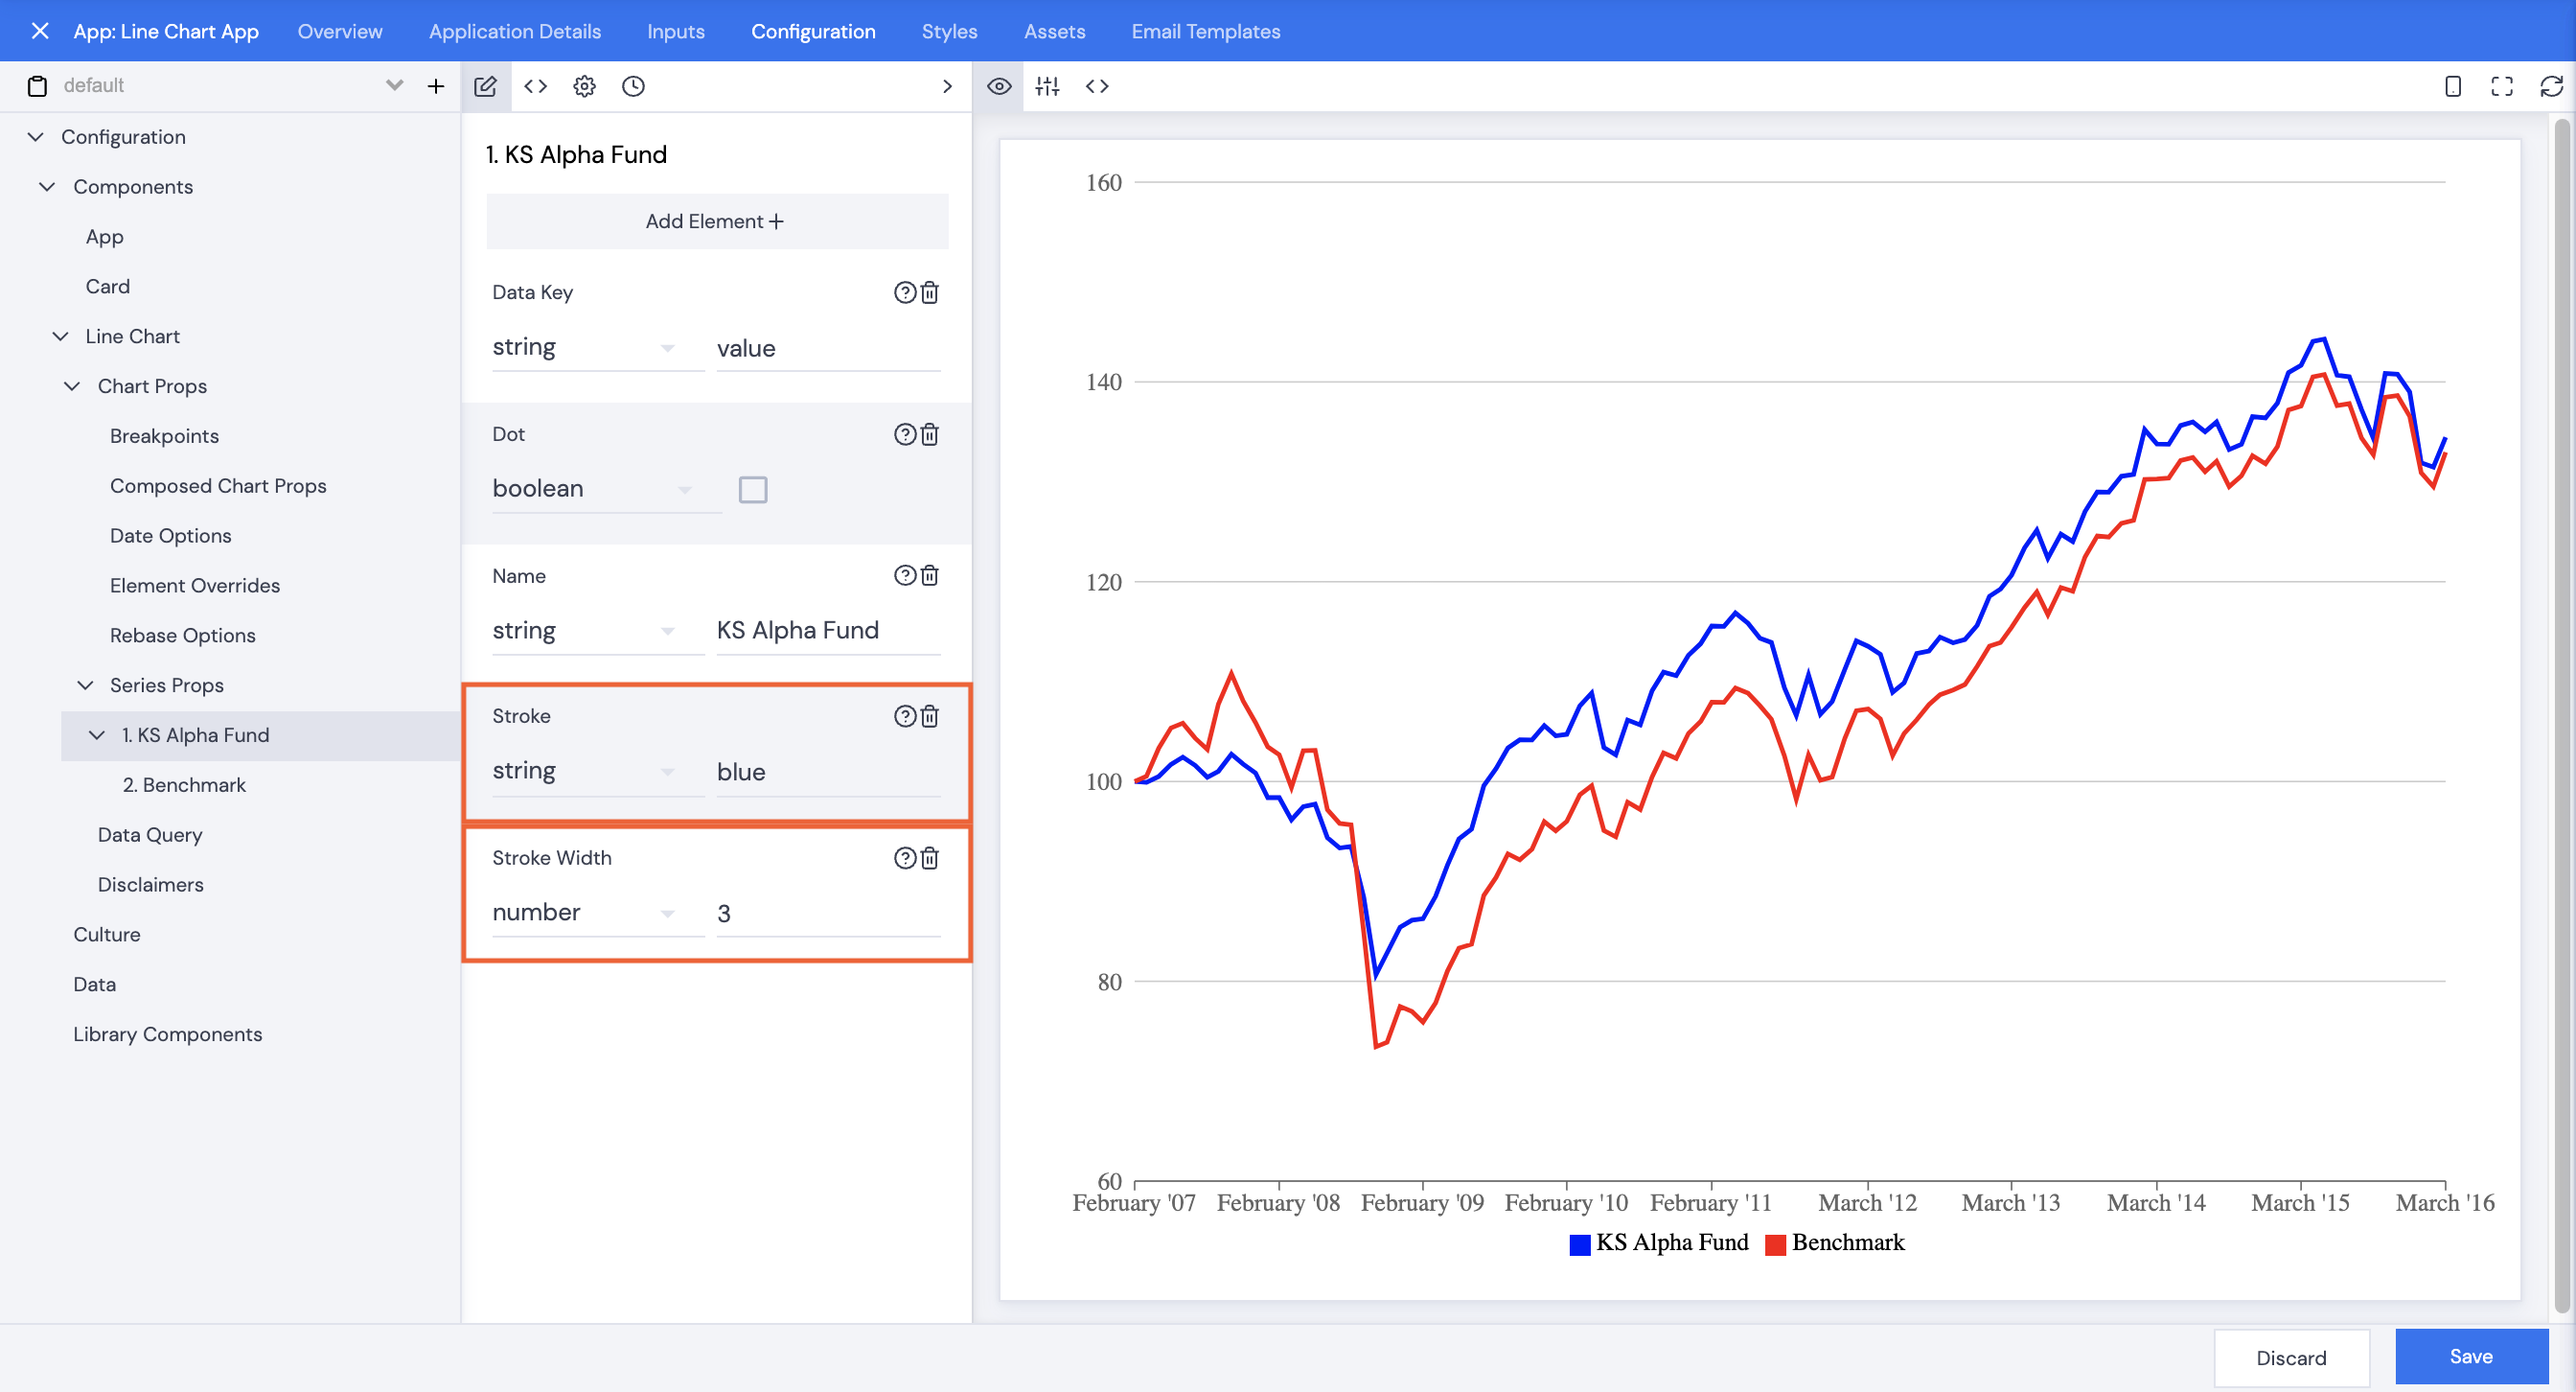
- Type in a color name or hex code in the Stroke field.
- Type in a stroke width (in pixels).
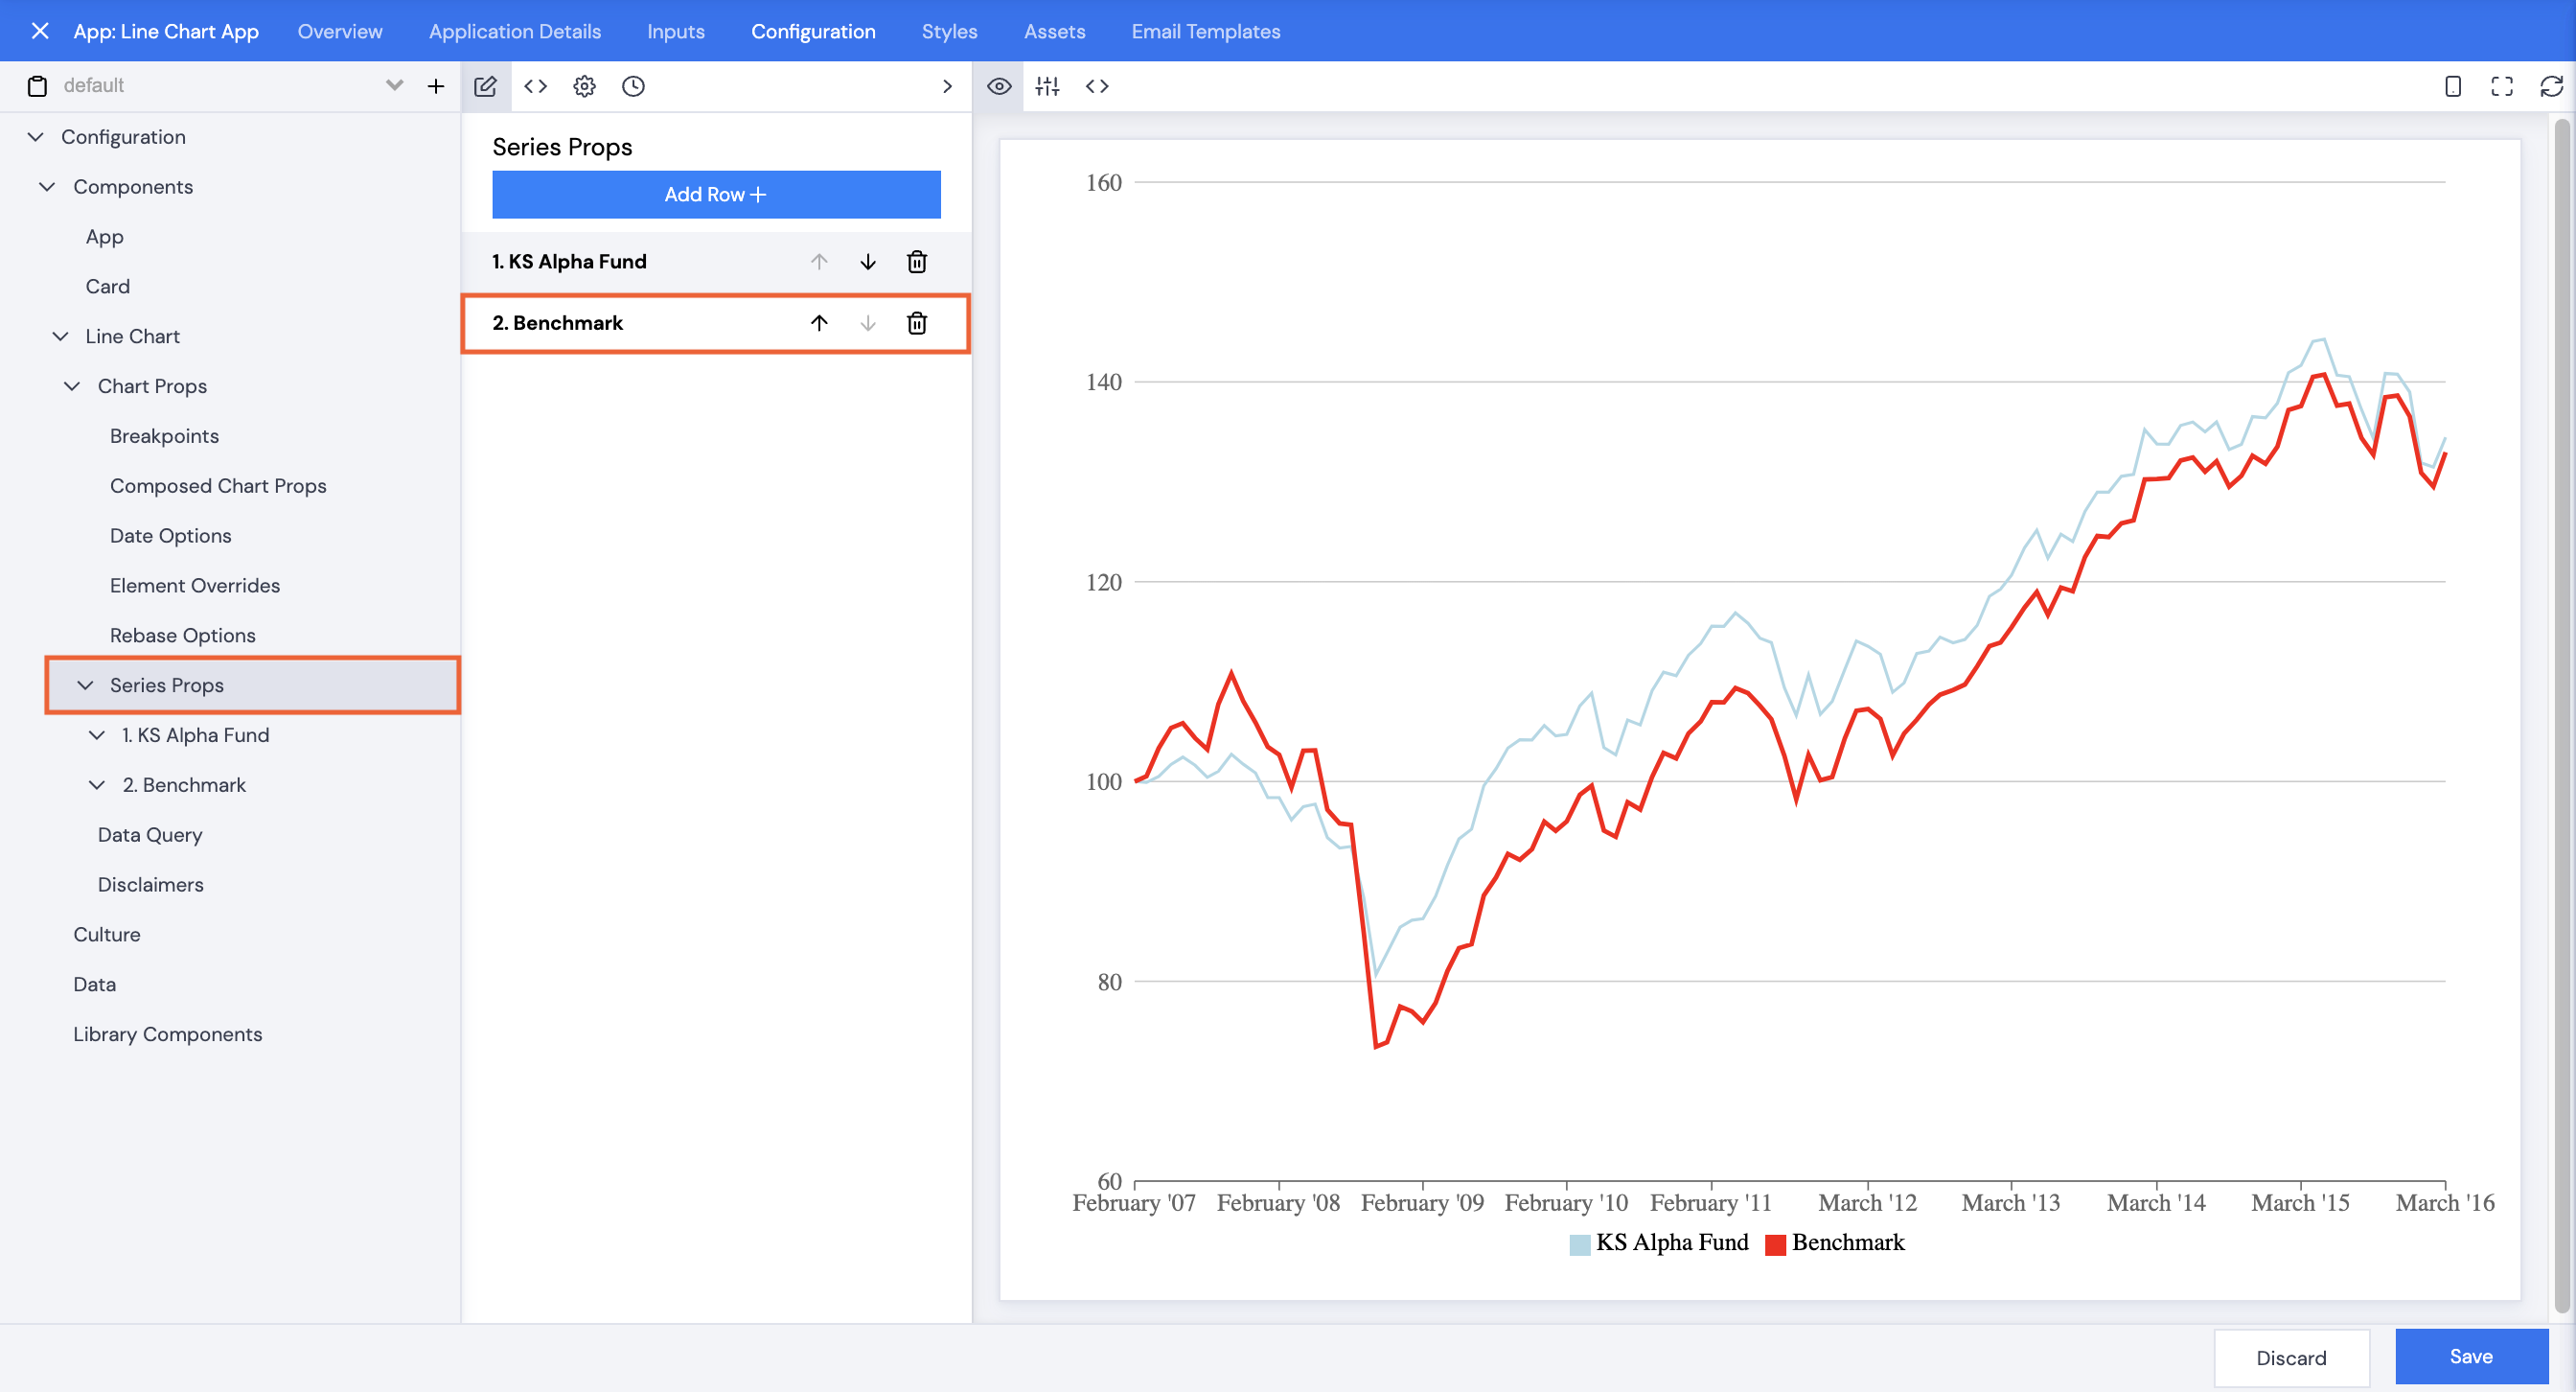
- Click back to Series Props.
- Repeat this process for any additional lines.
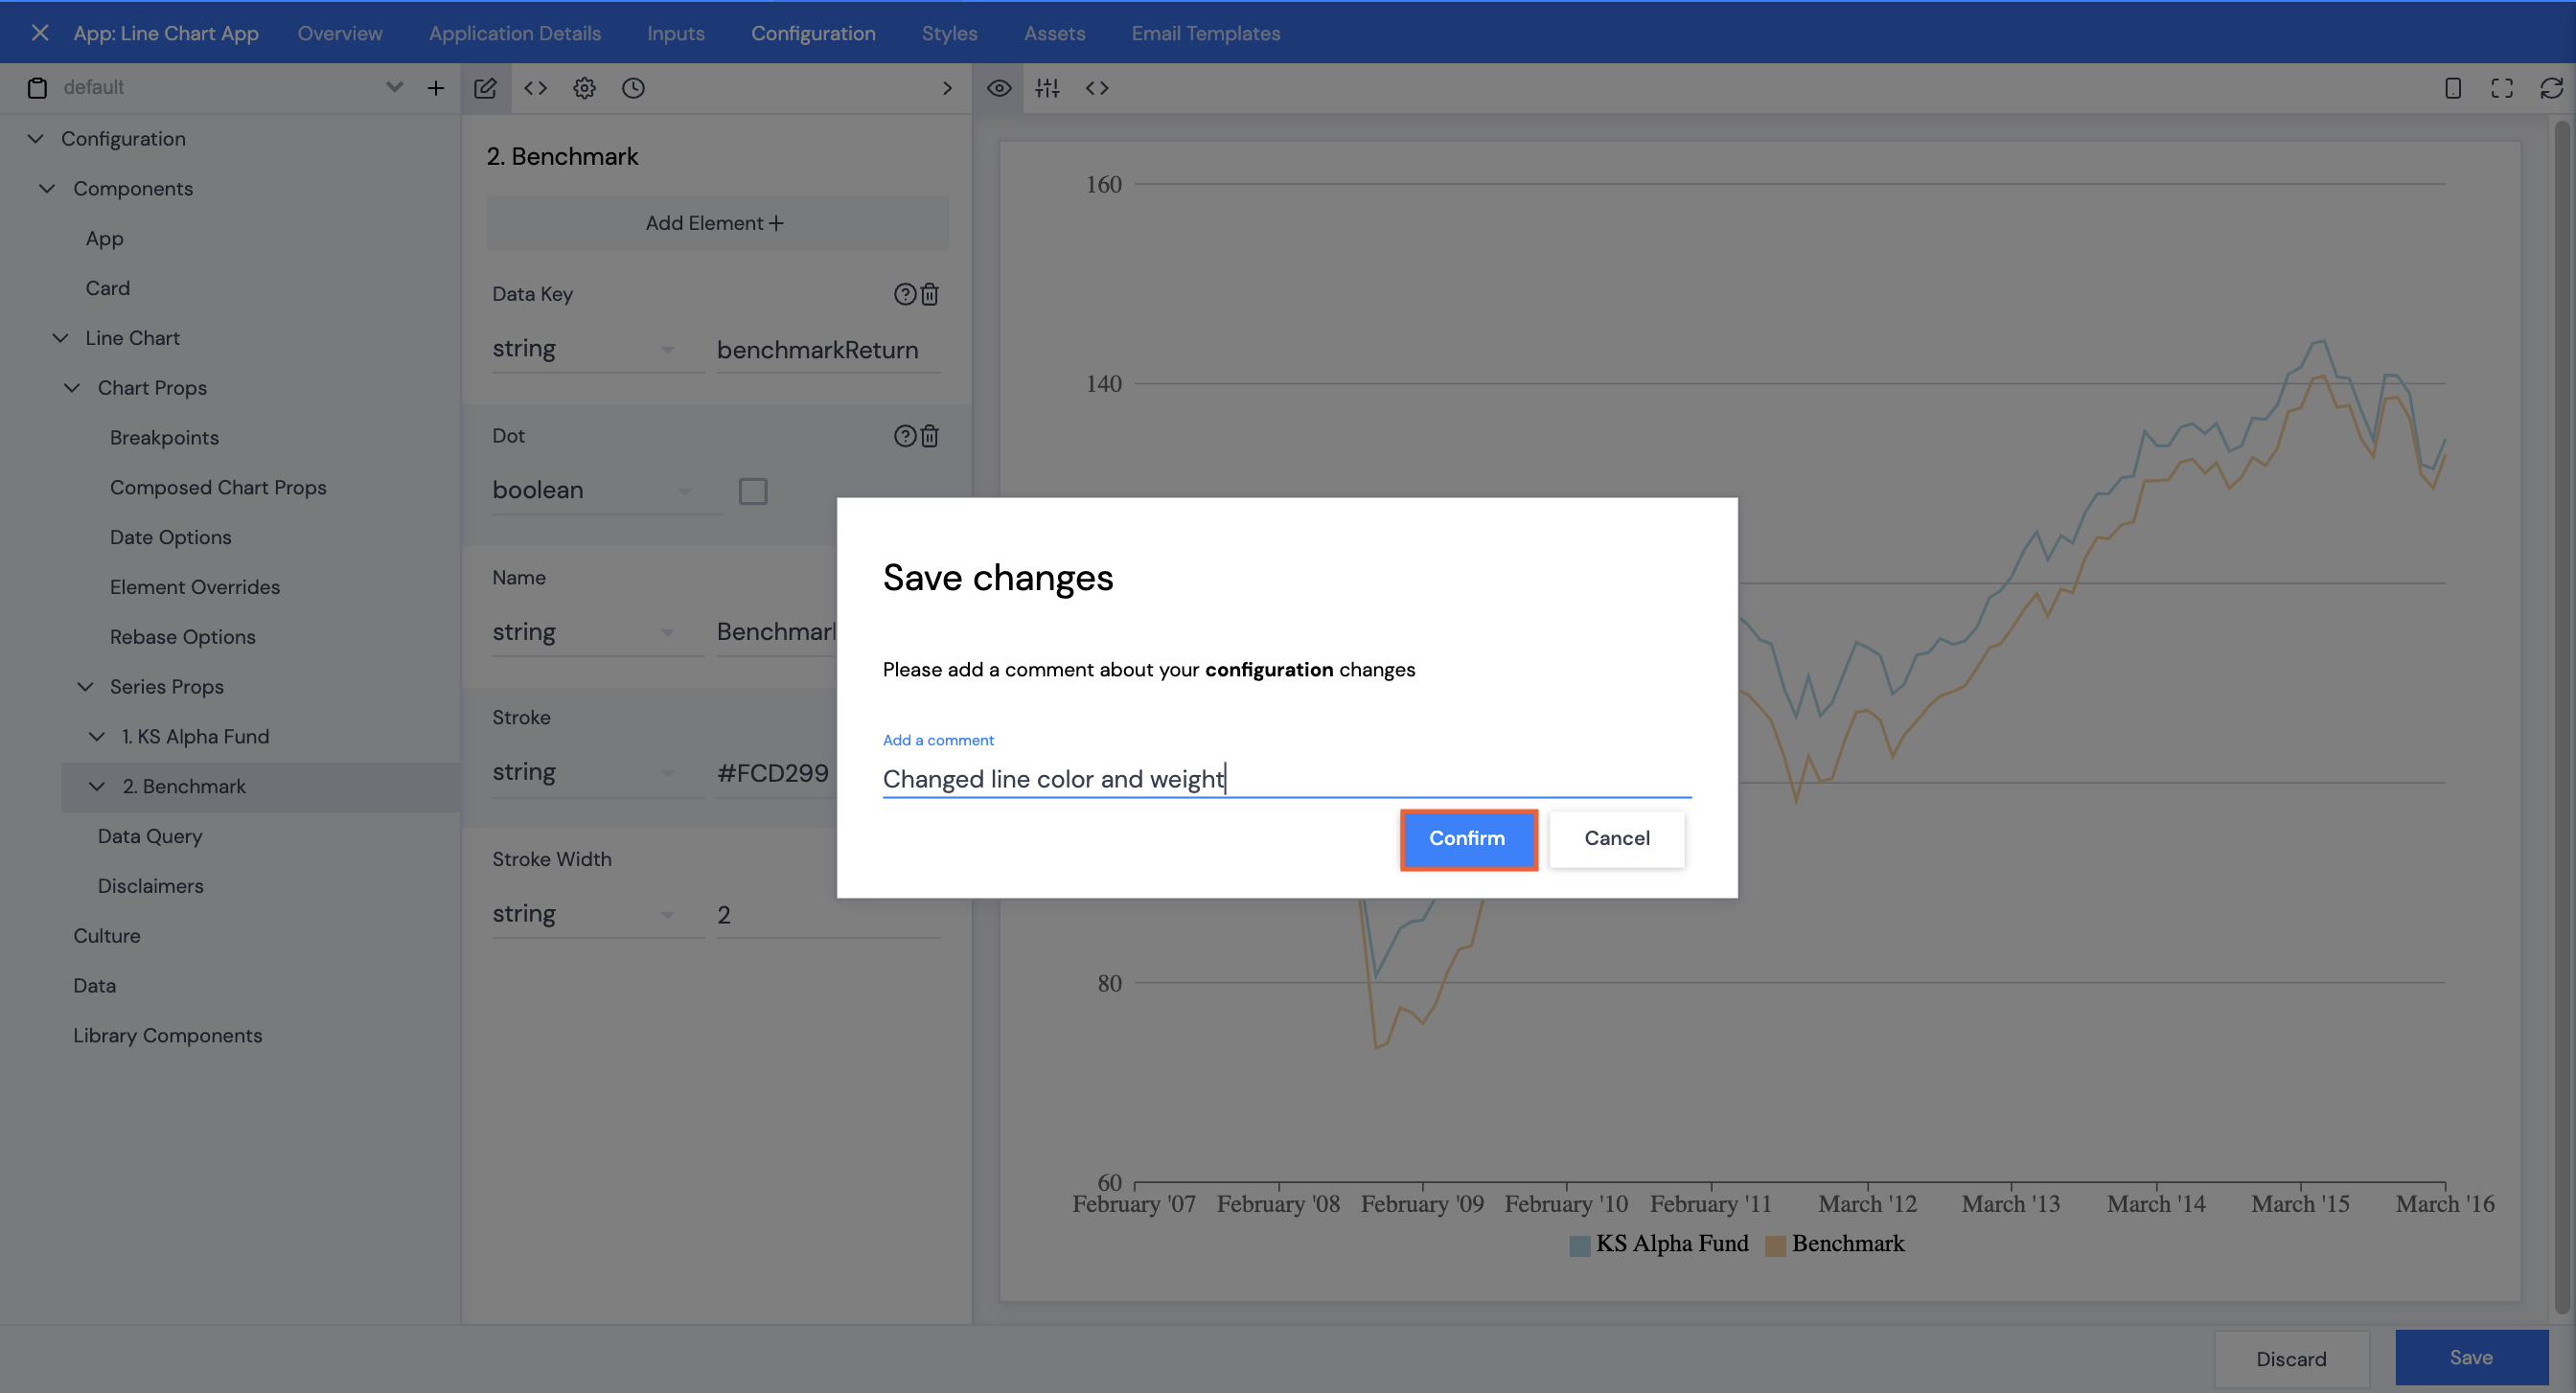
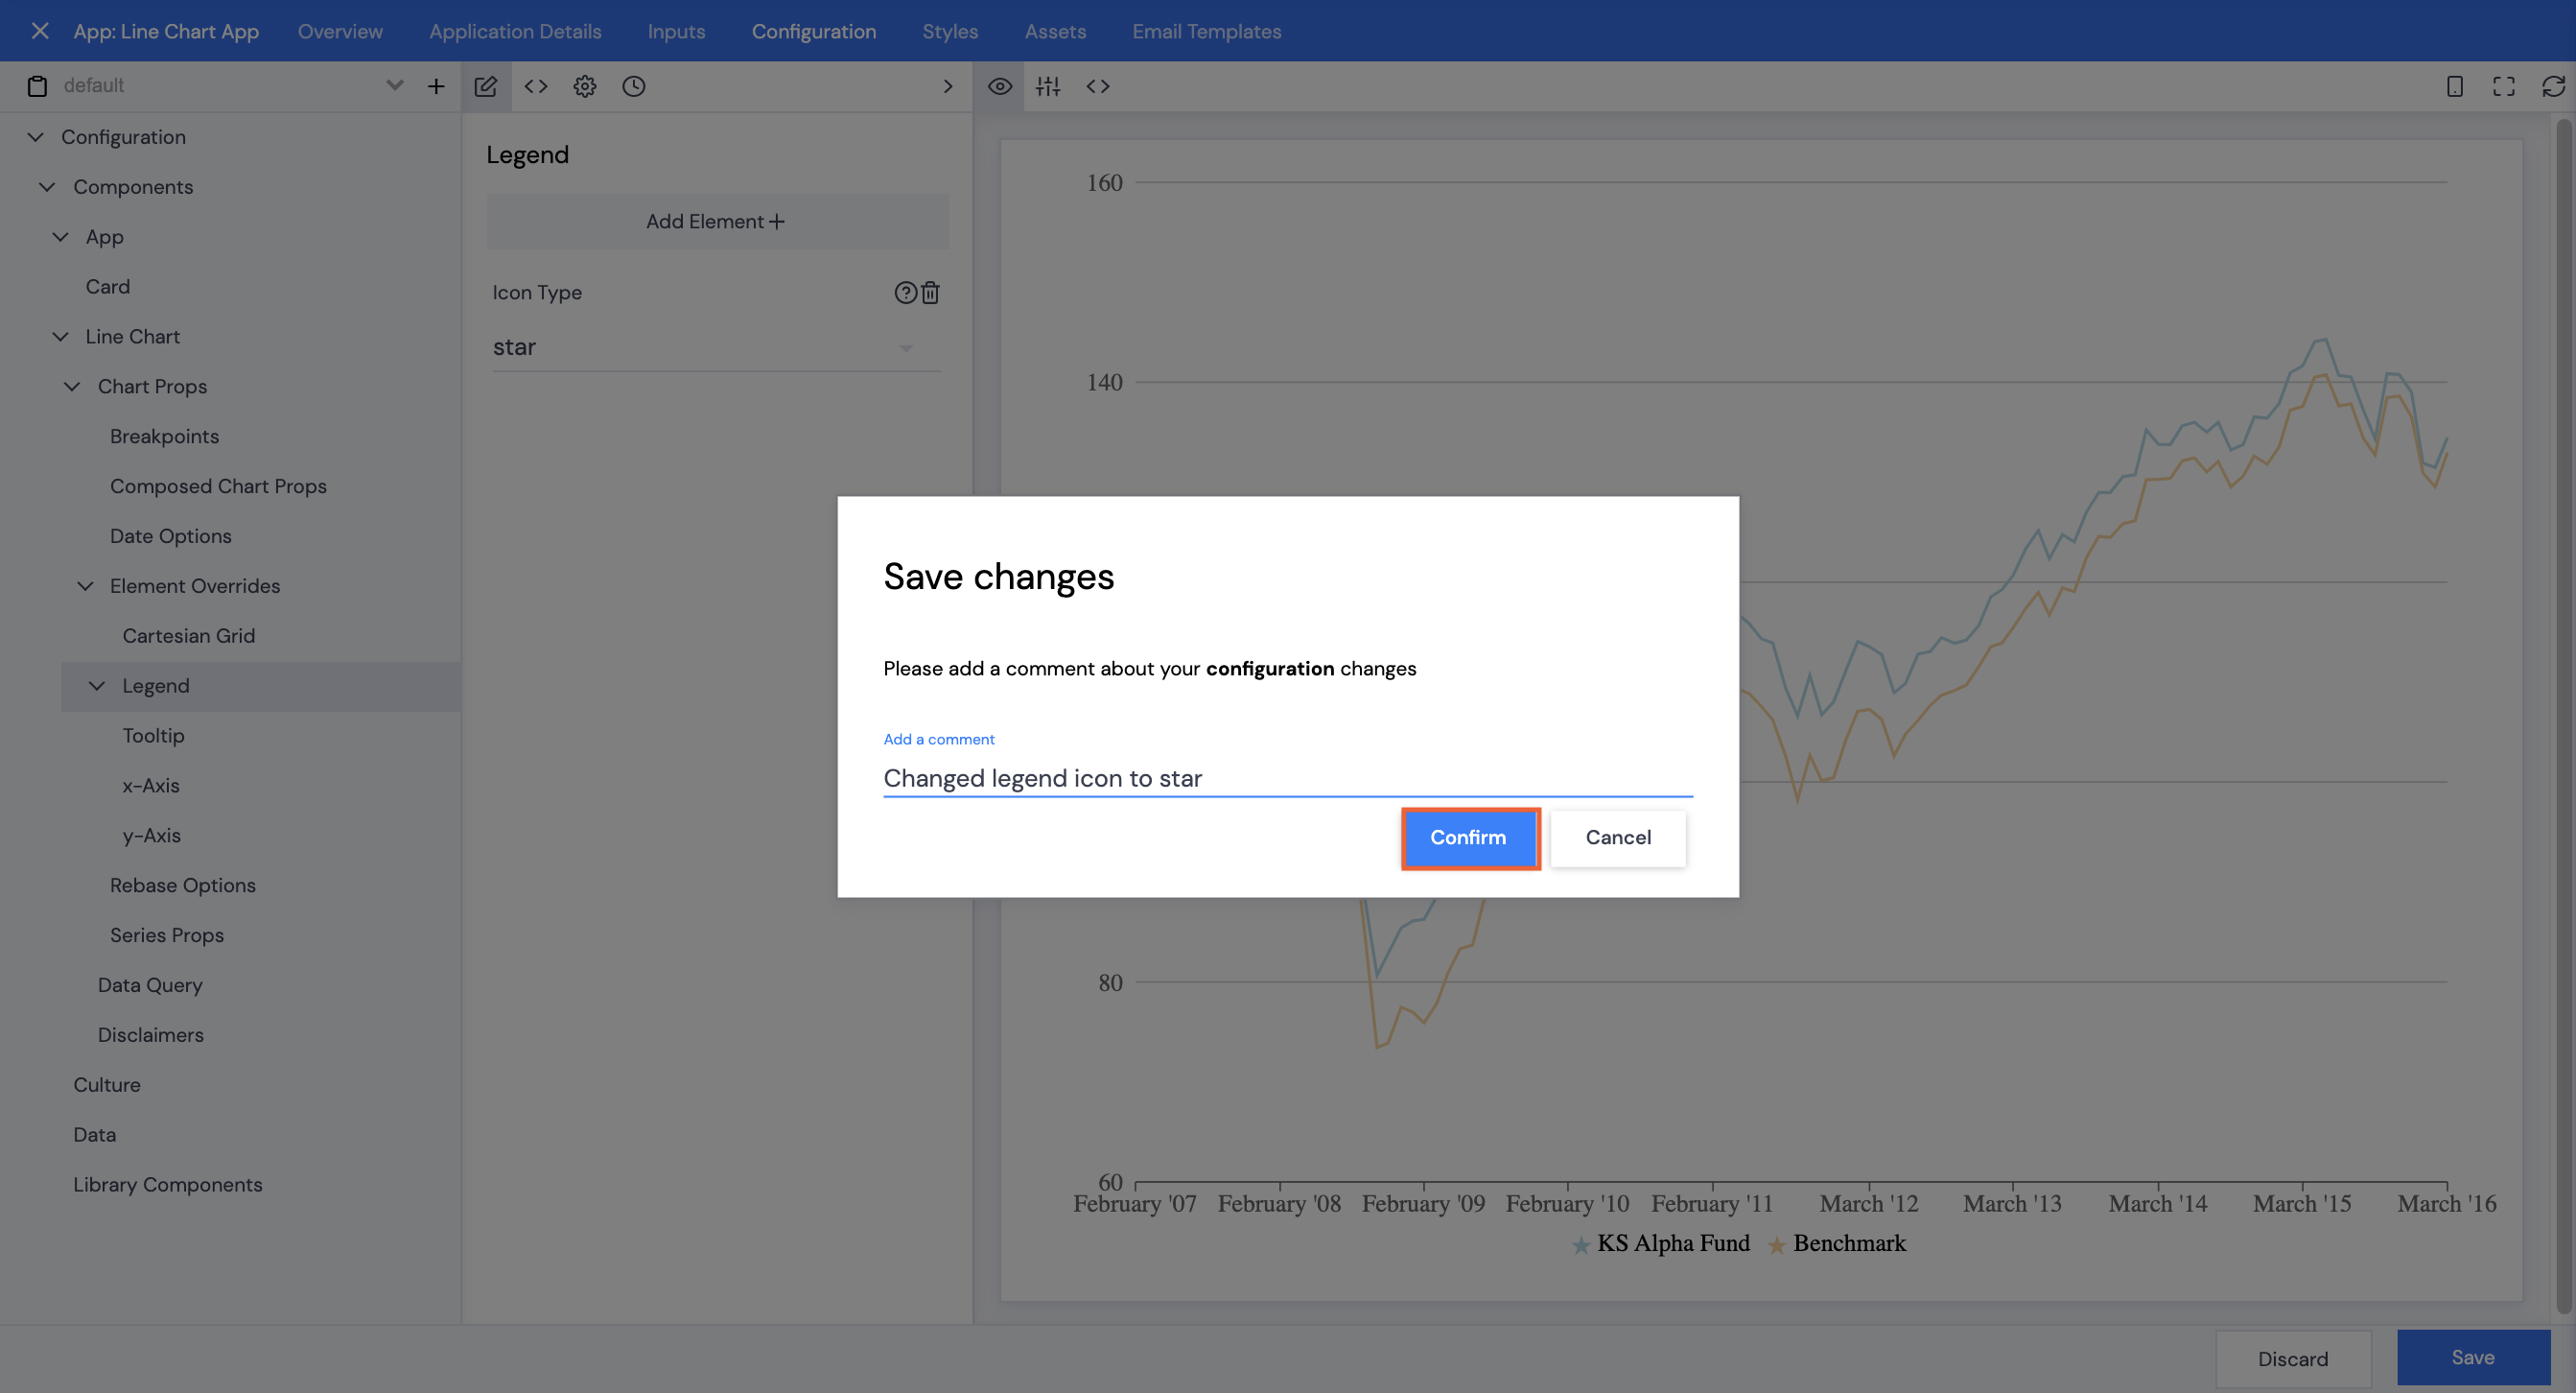
- Click Save.
- Type in a comment, then click Confirm.
Legend Icon
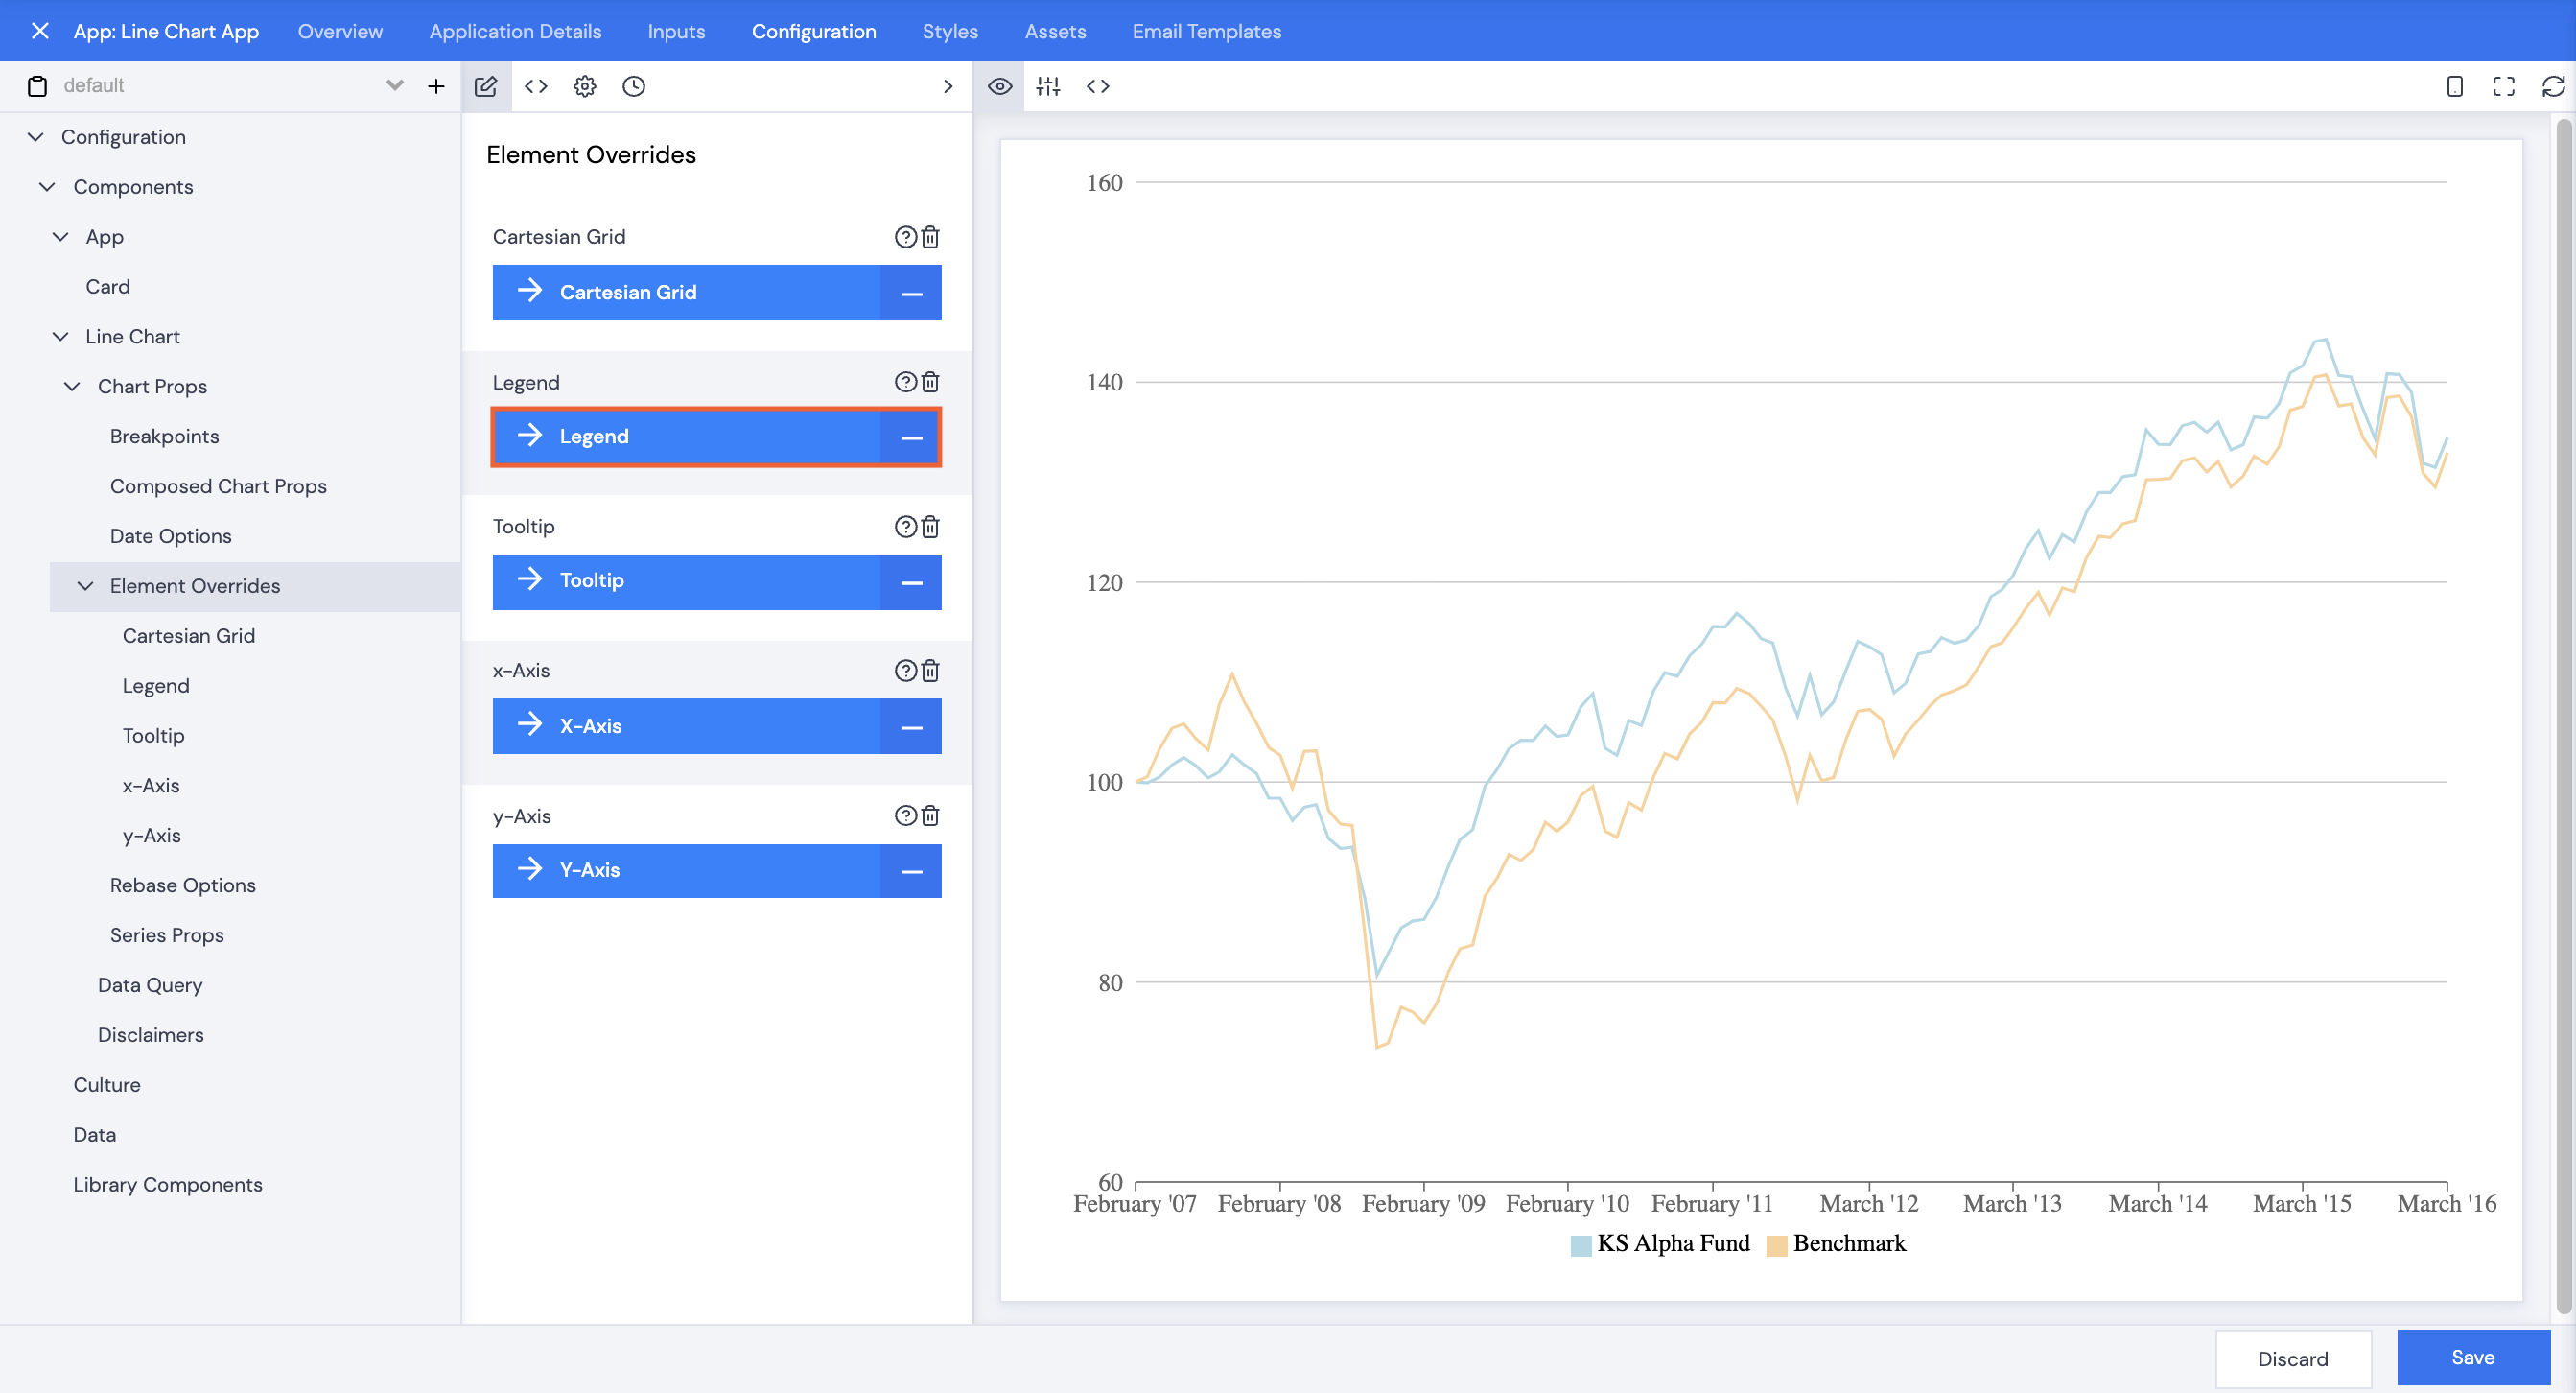
- With the Configuration tab selected, browse to Components | Line Chart | Chart Props.
- Click Element Overrides.
- Click Legend.
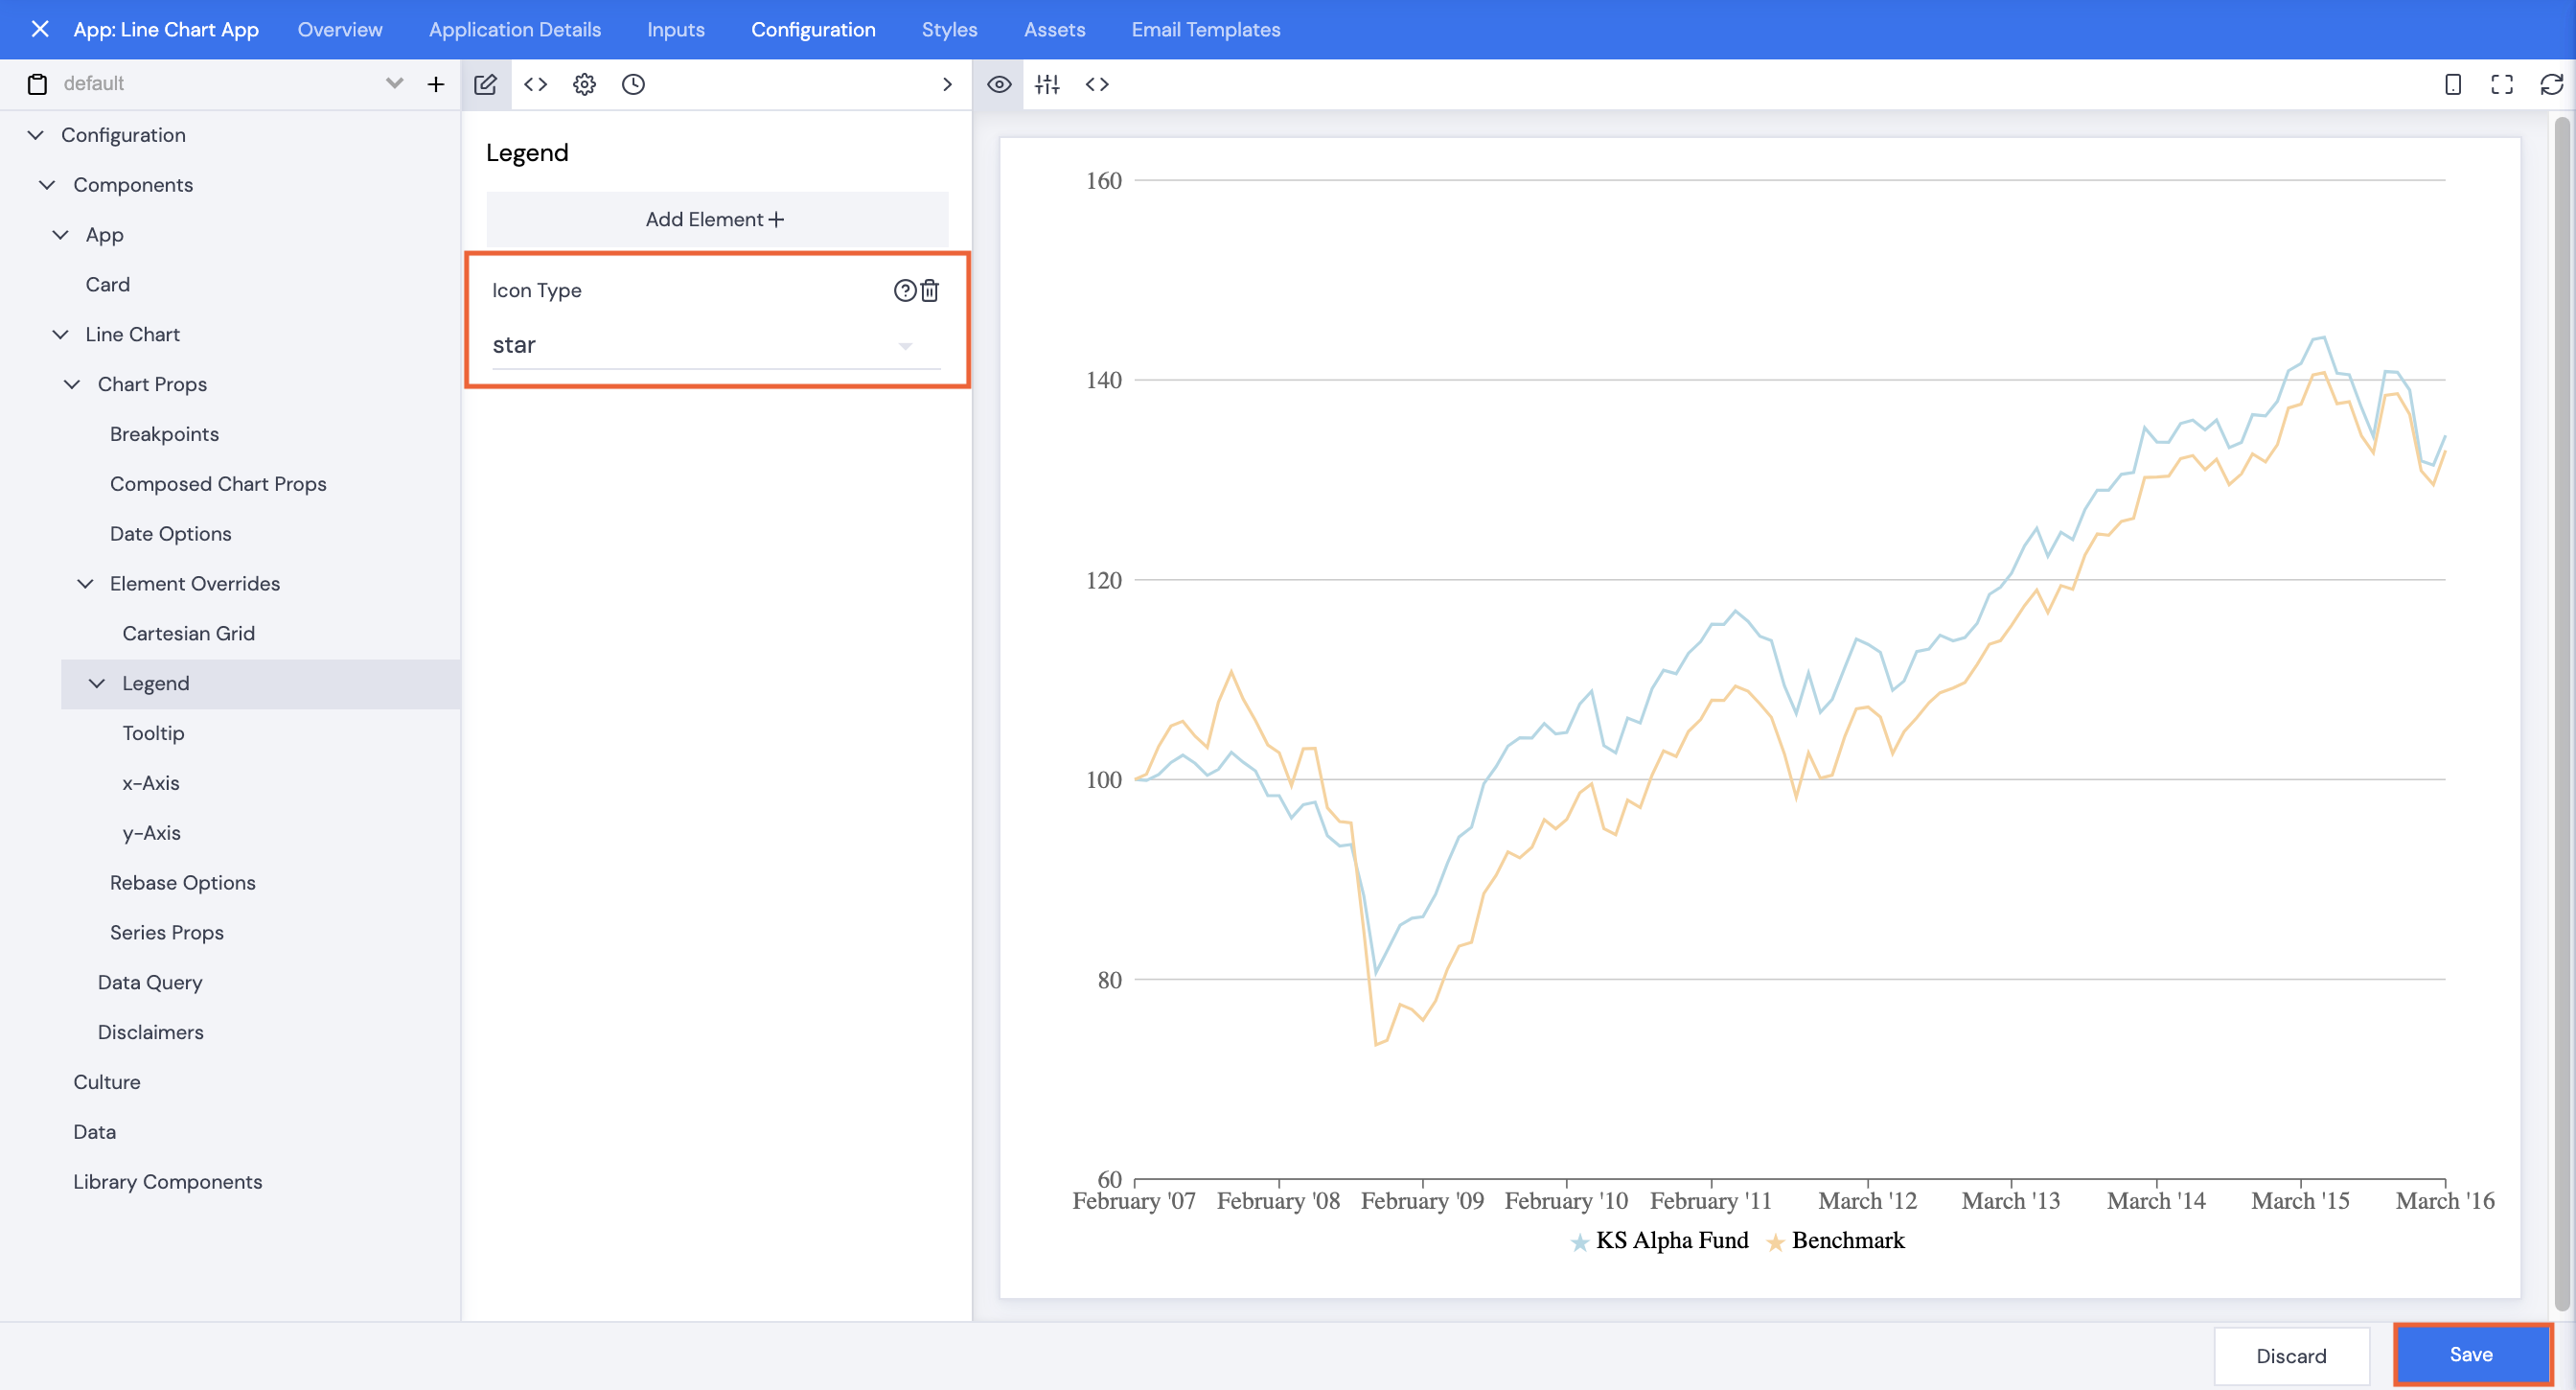
- Use the dropdown arrow to select a different Icon Type, e.g. star.
- Click Save.
- Type in a comment, then click Confirm.
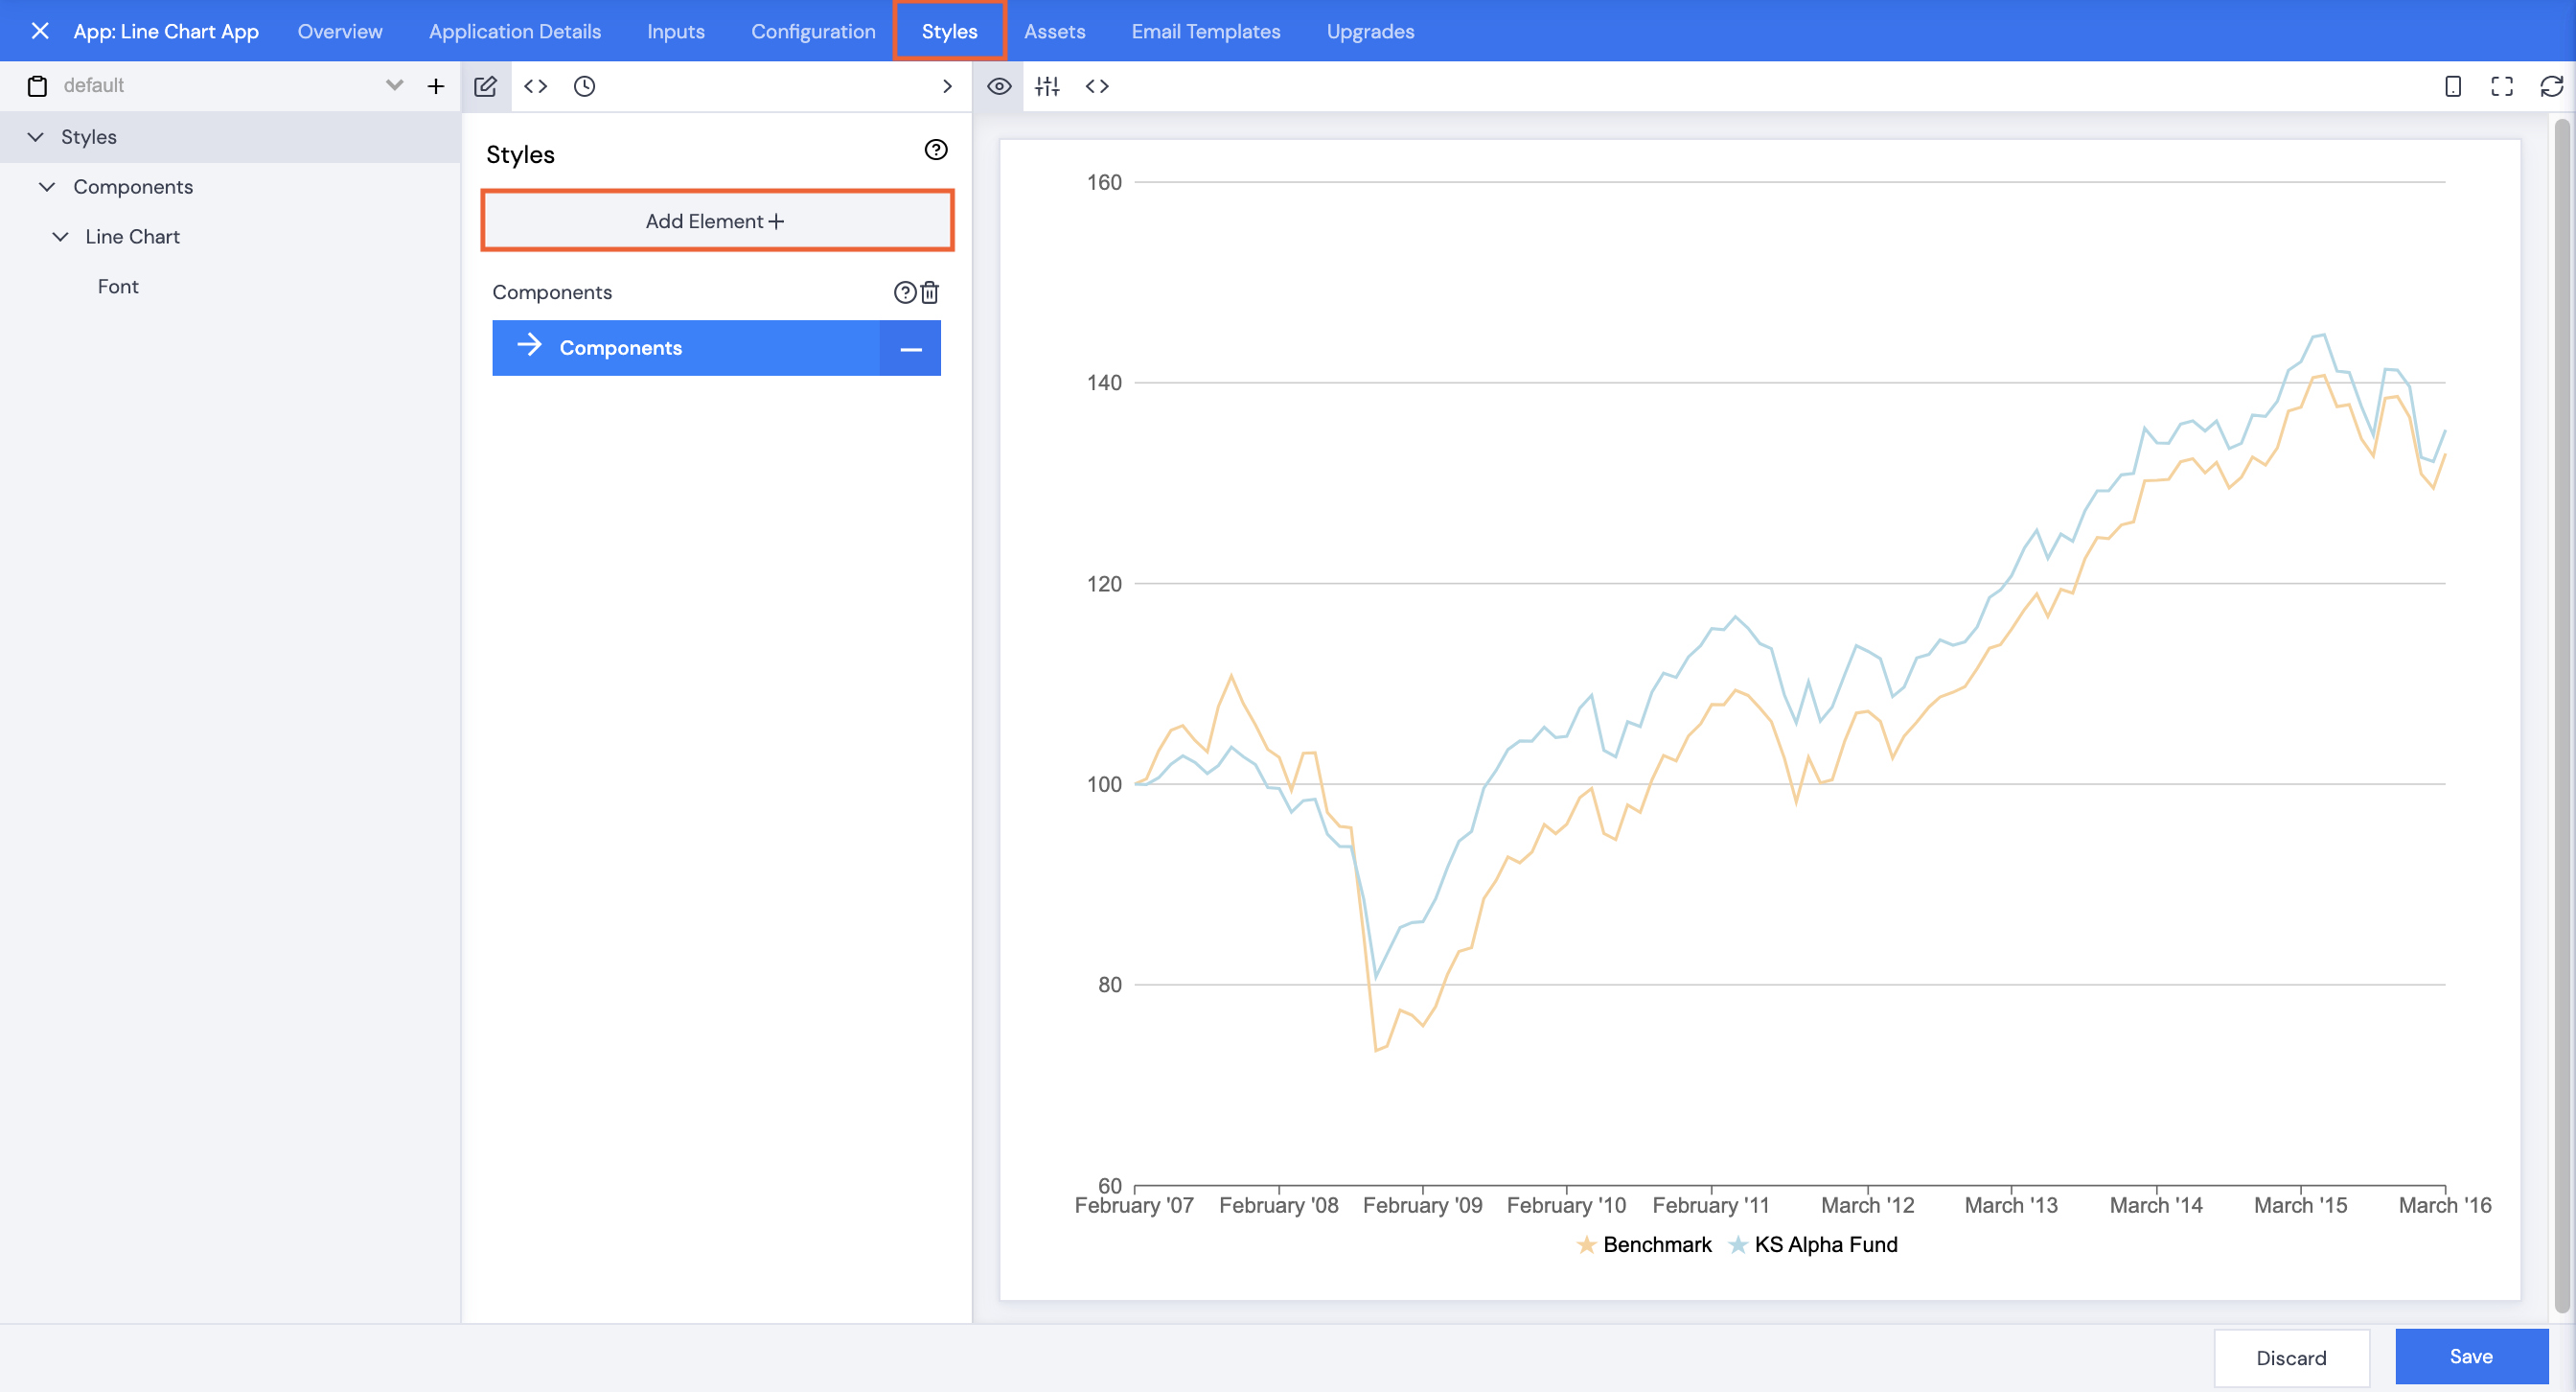
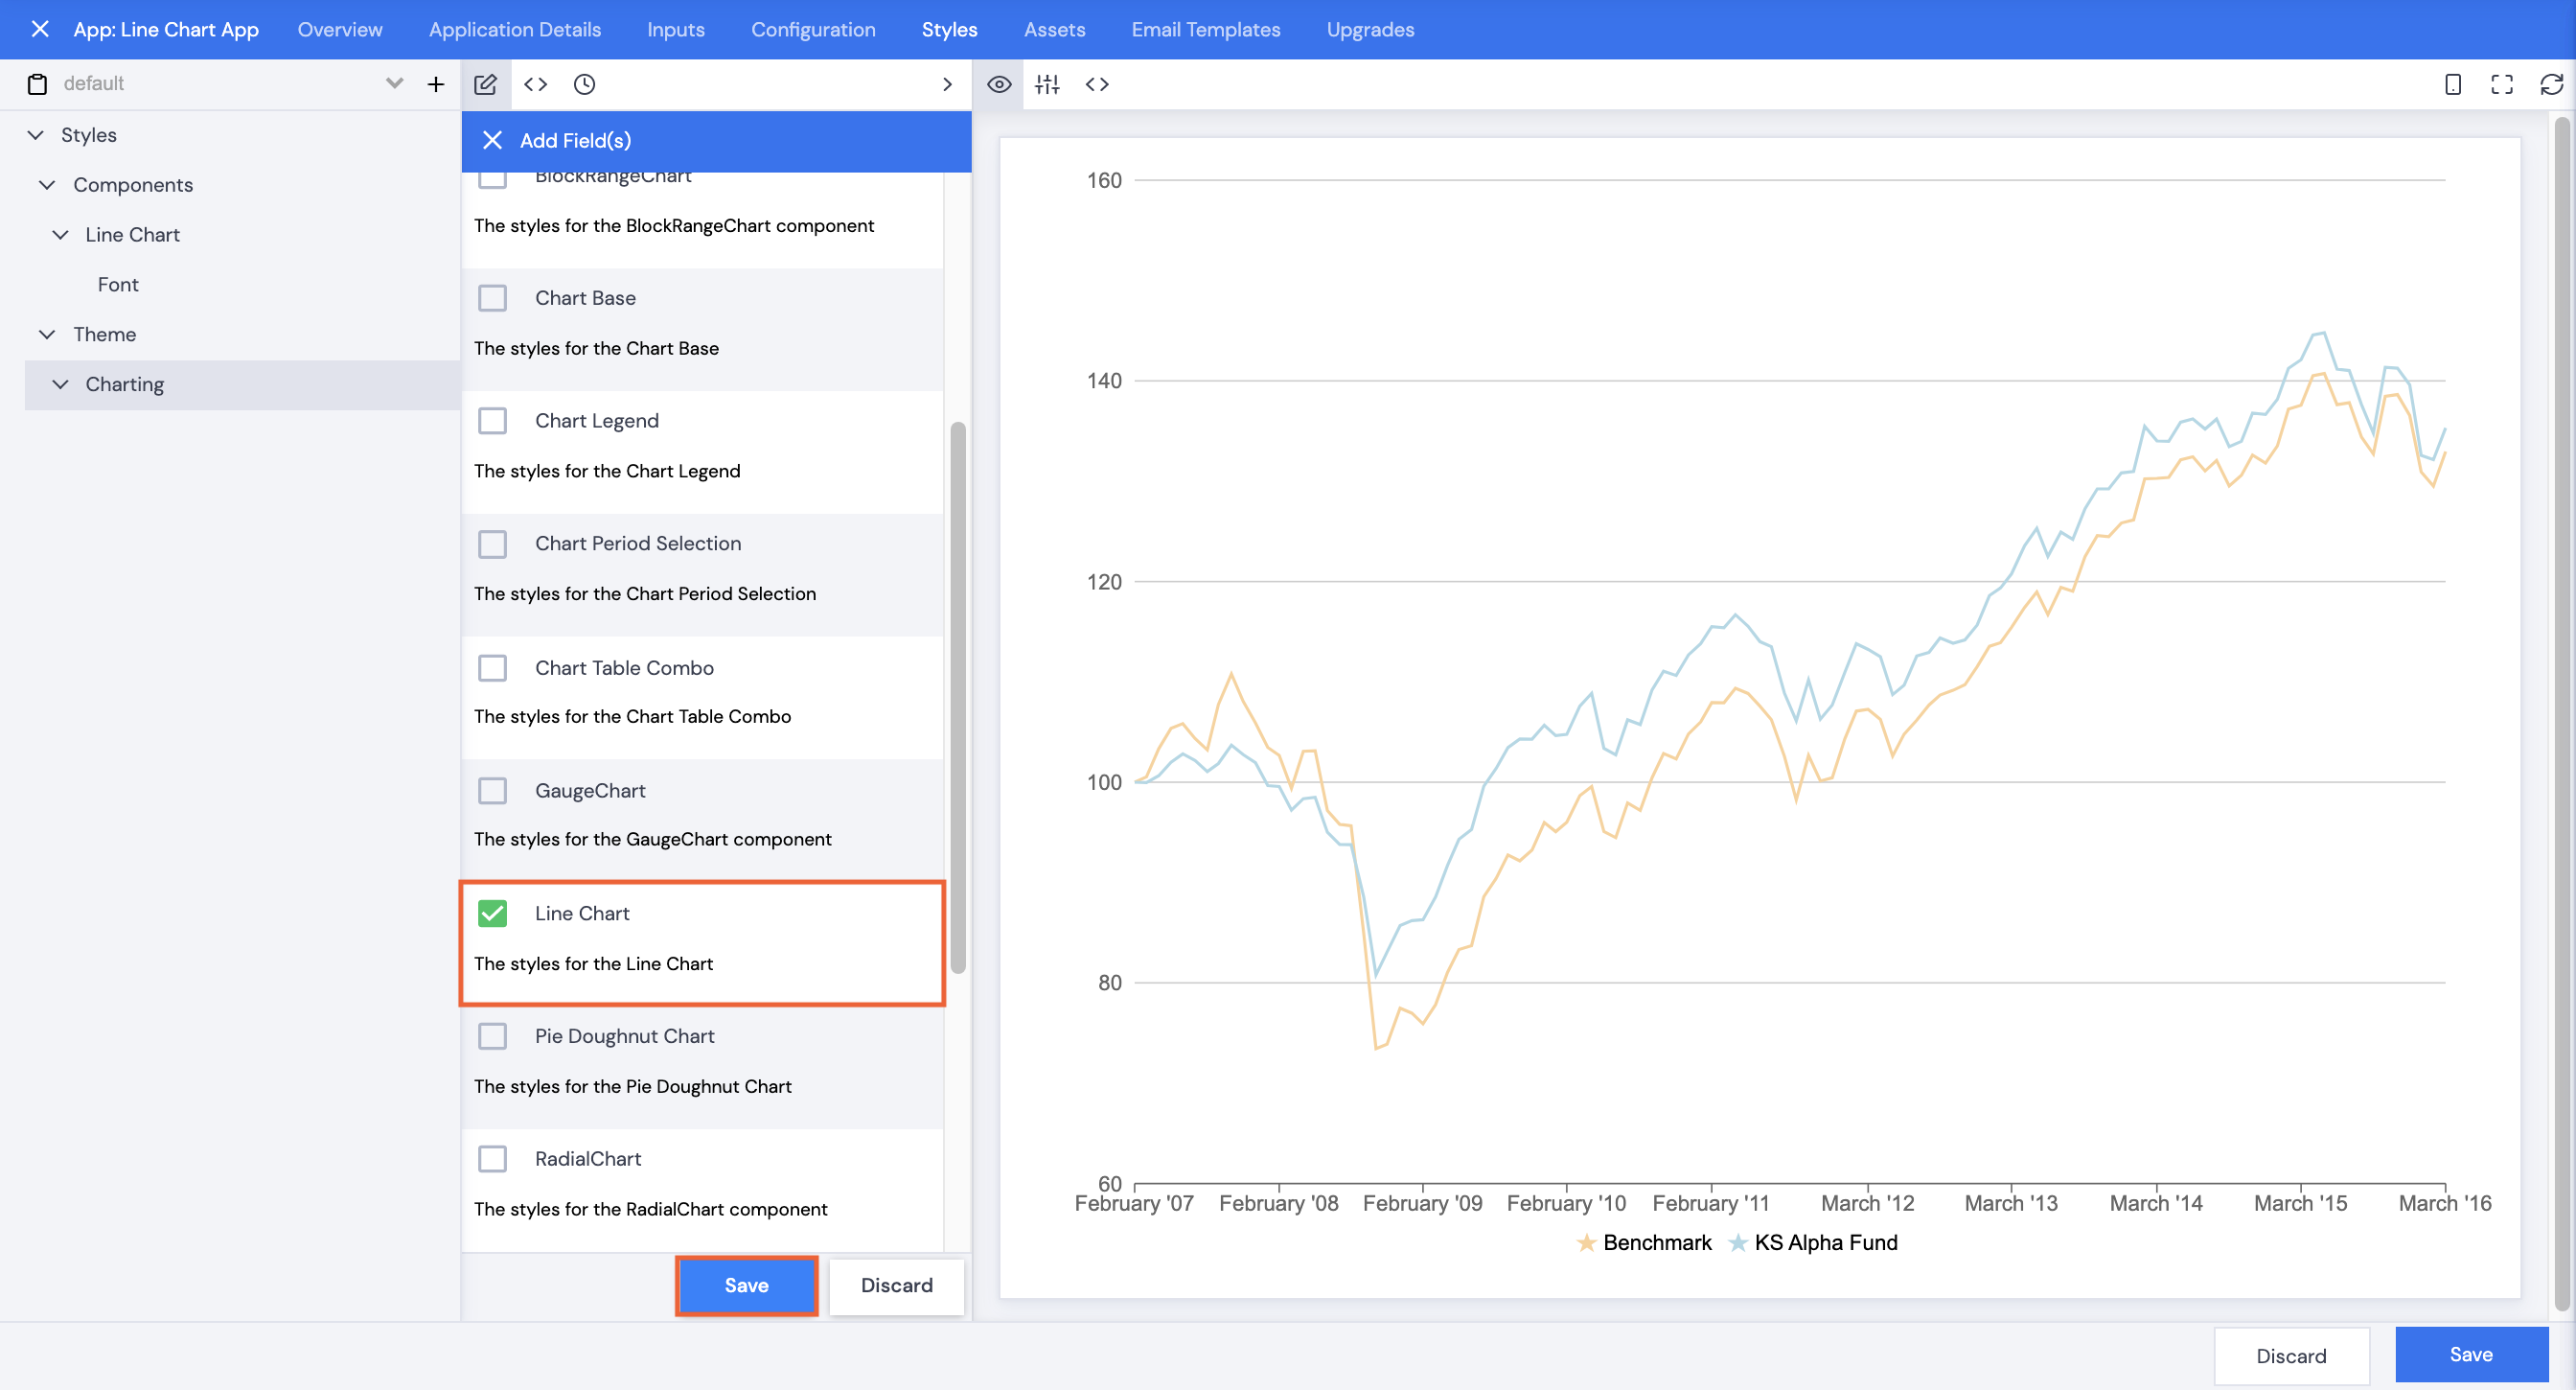
Font
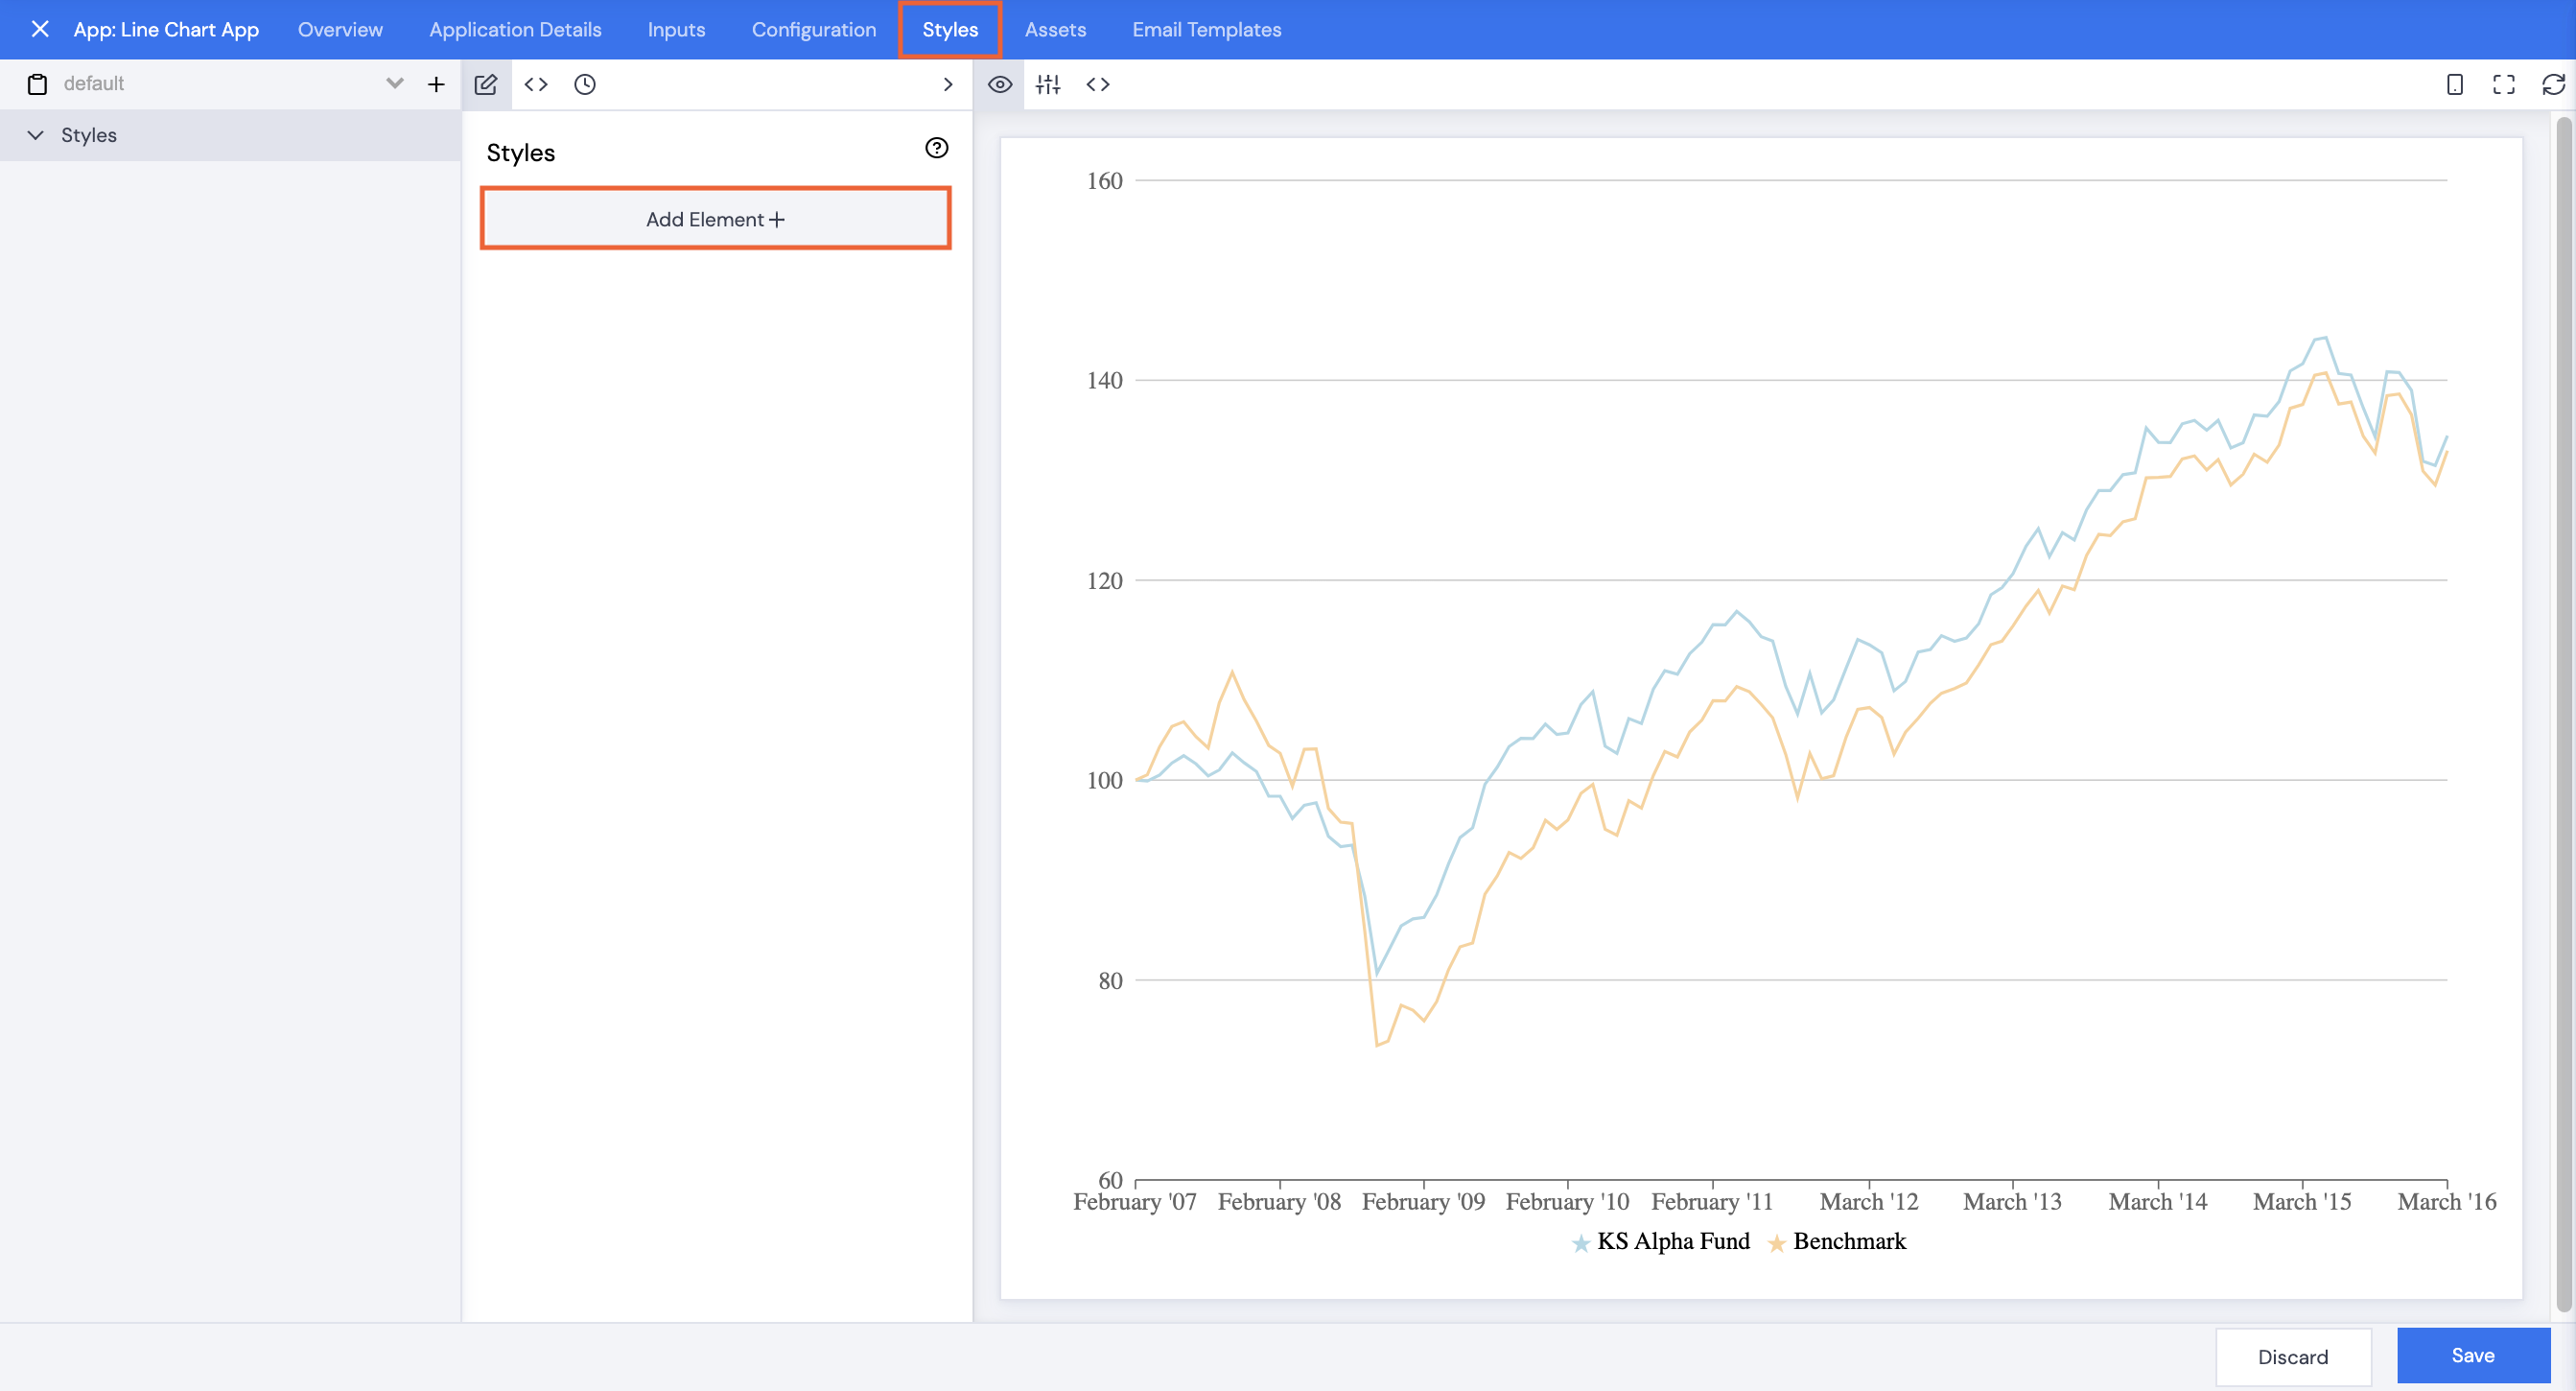
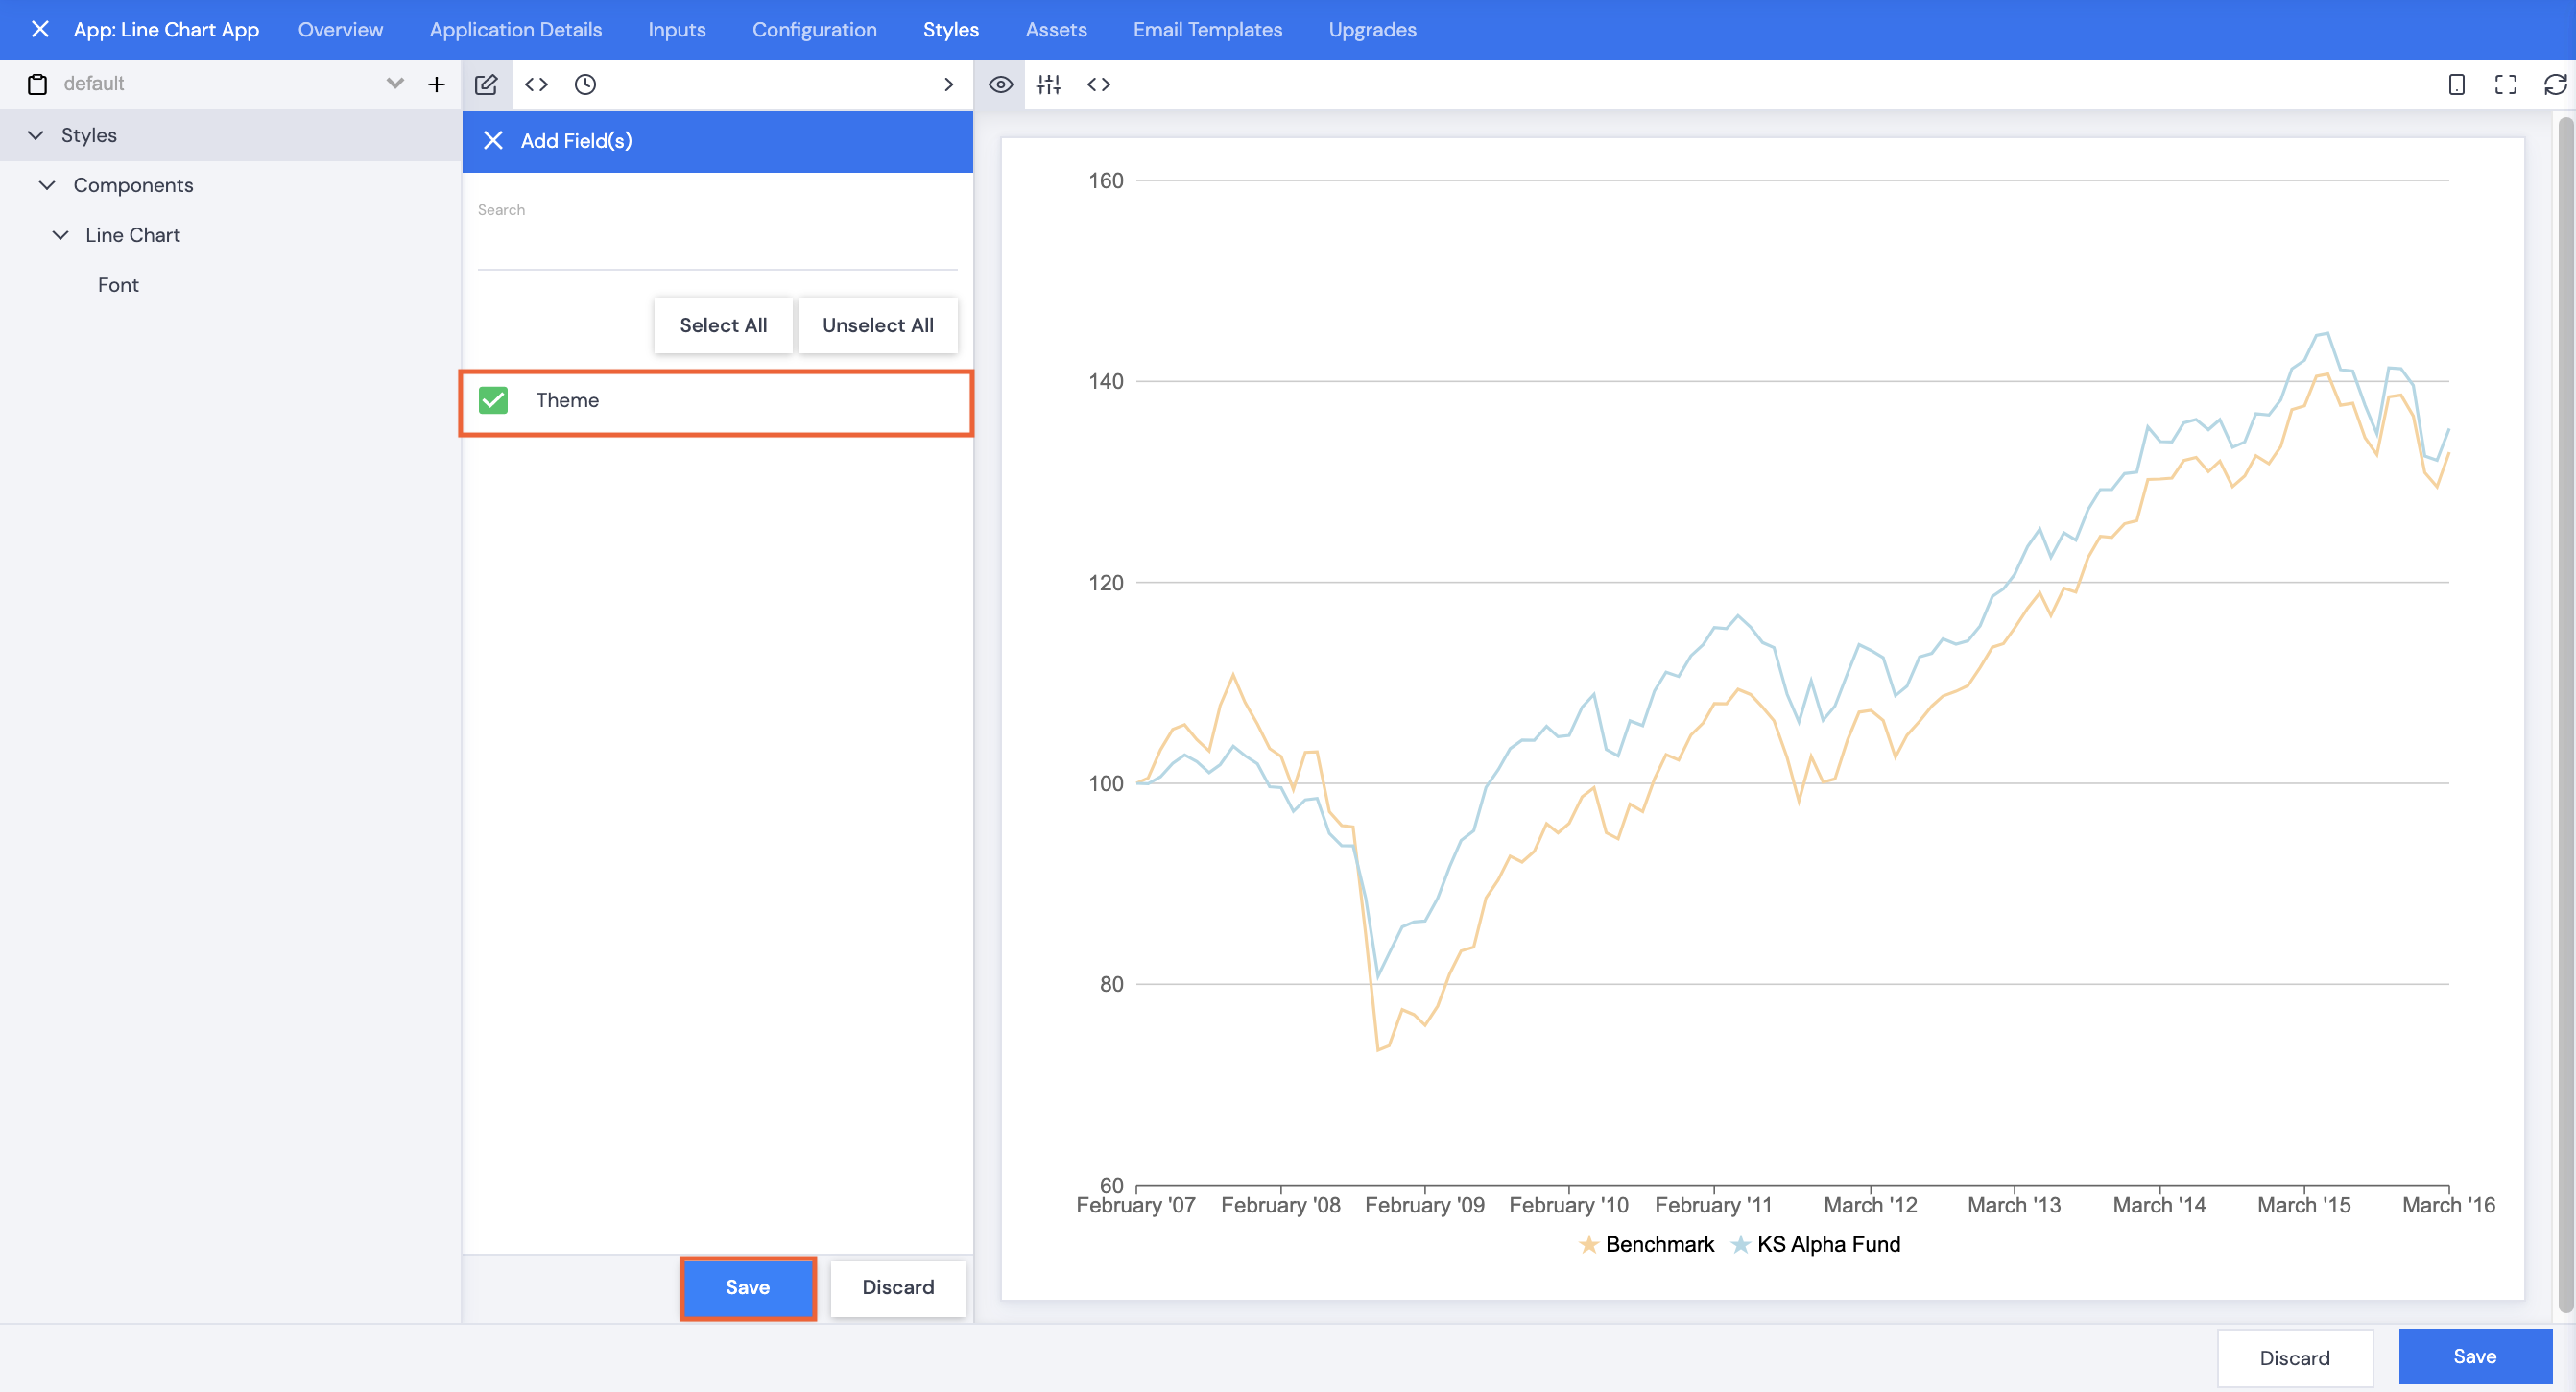
- With the Styles tab selected, click Add Element+.
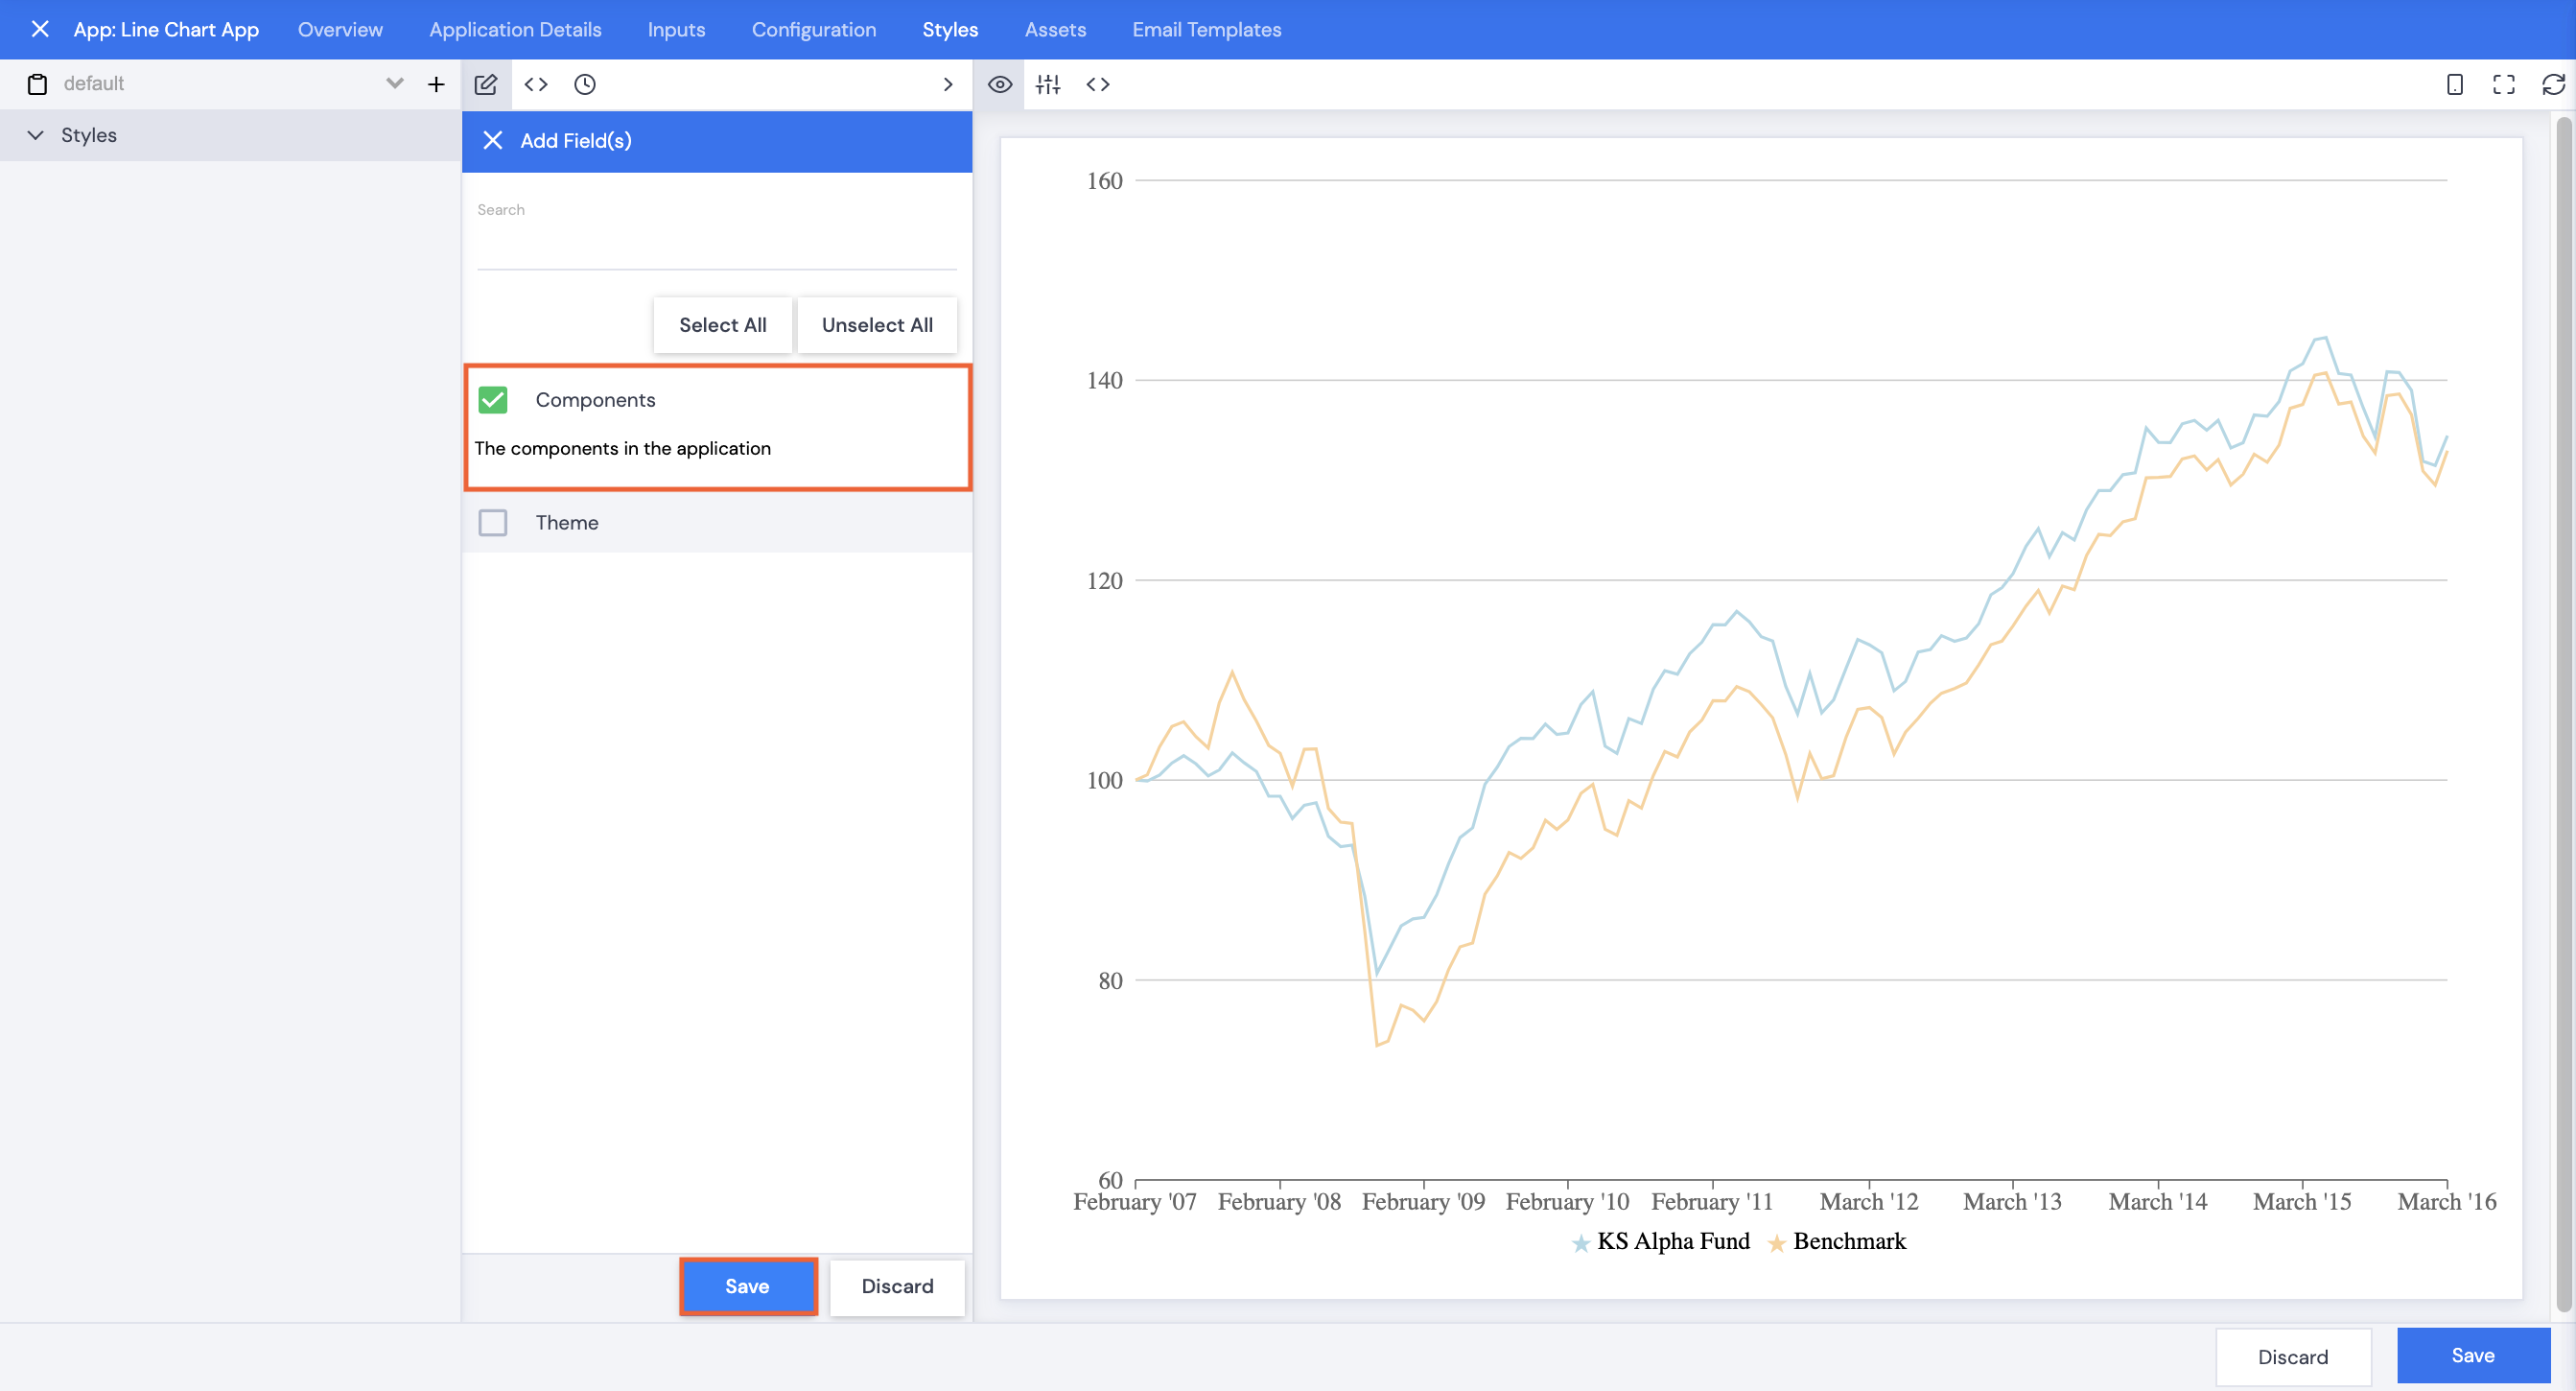
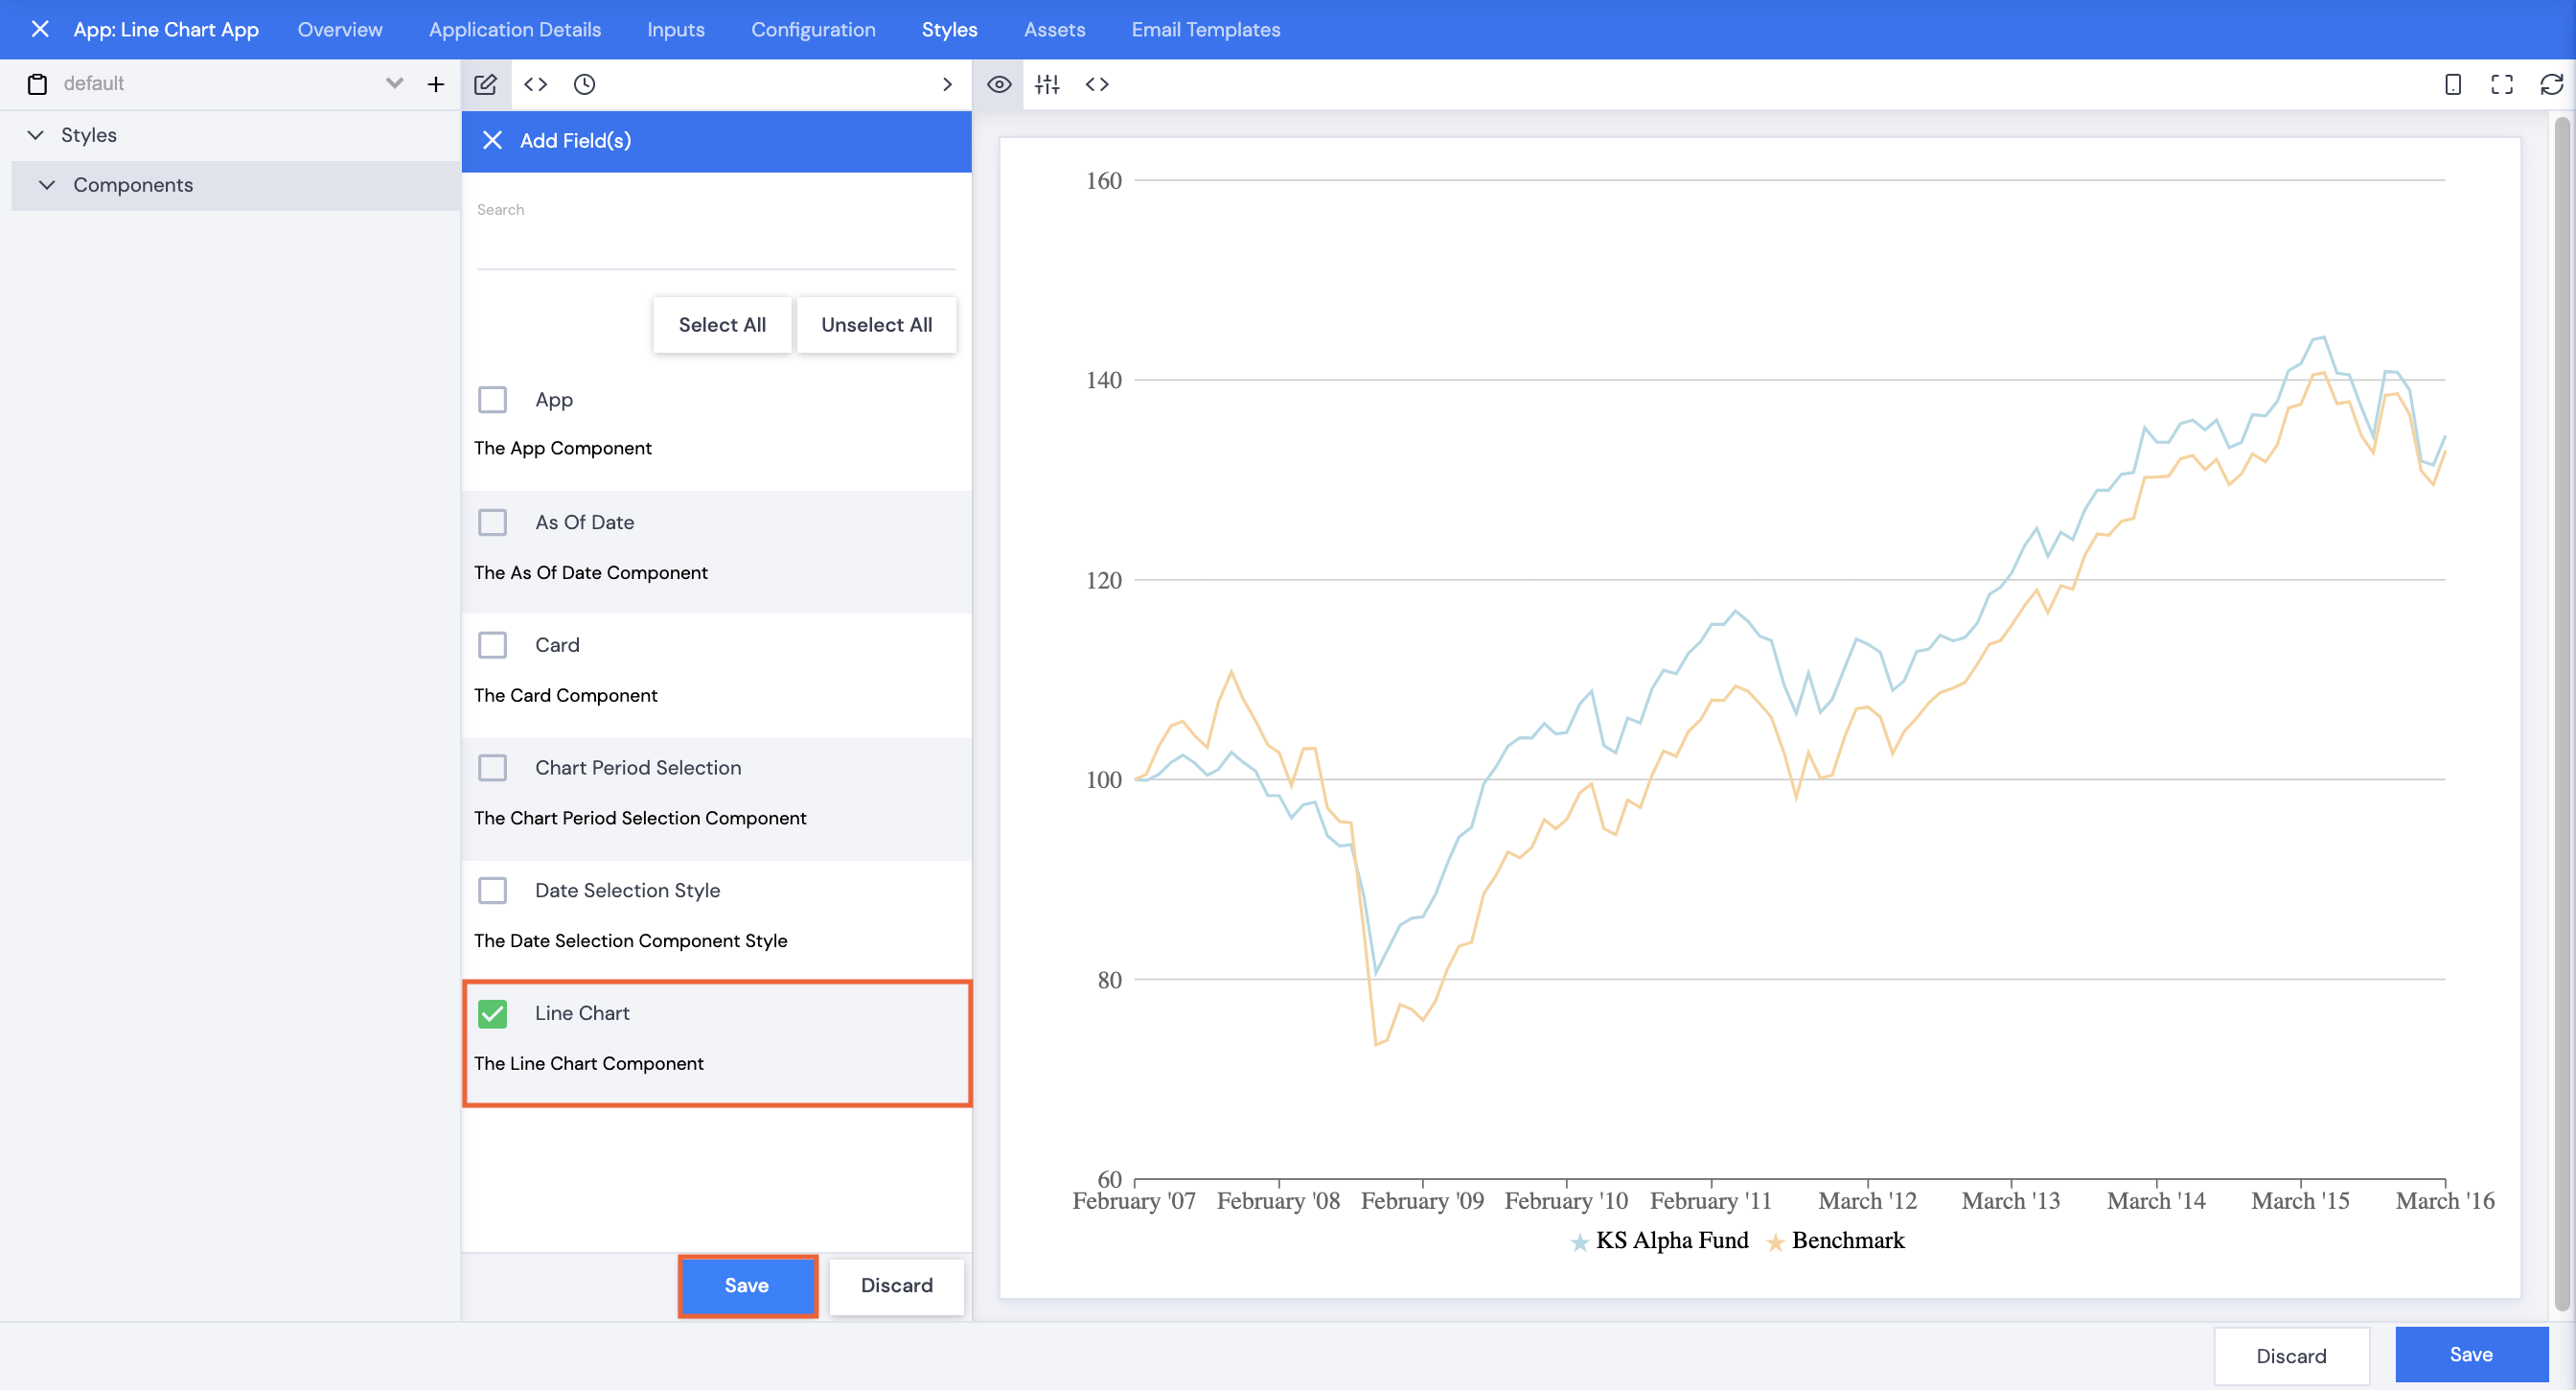
- Select Components.
- Click Save.
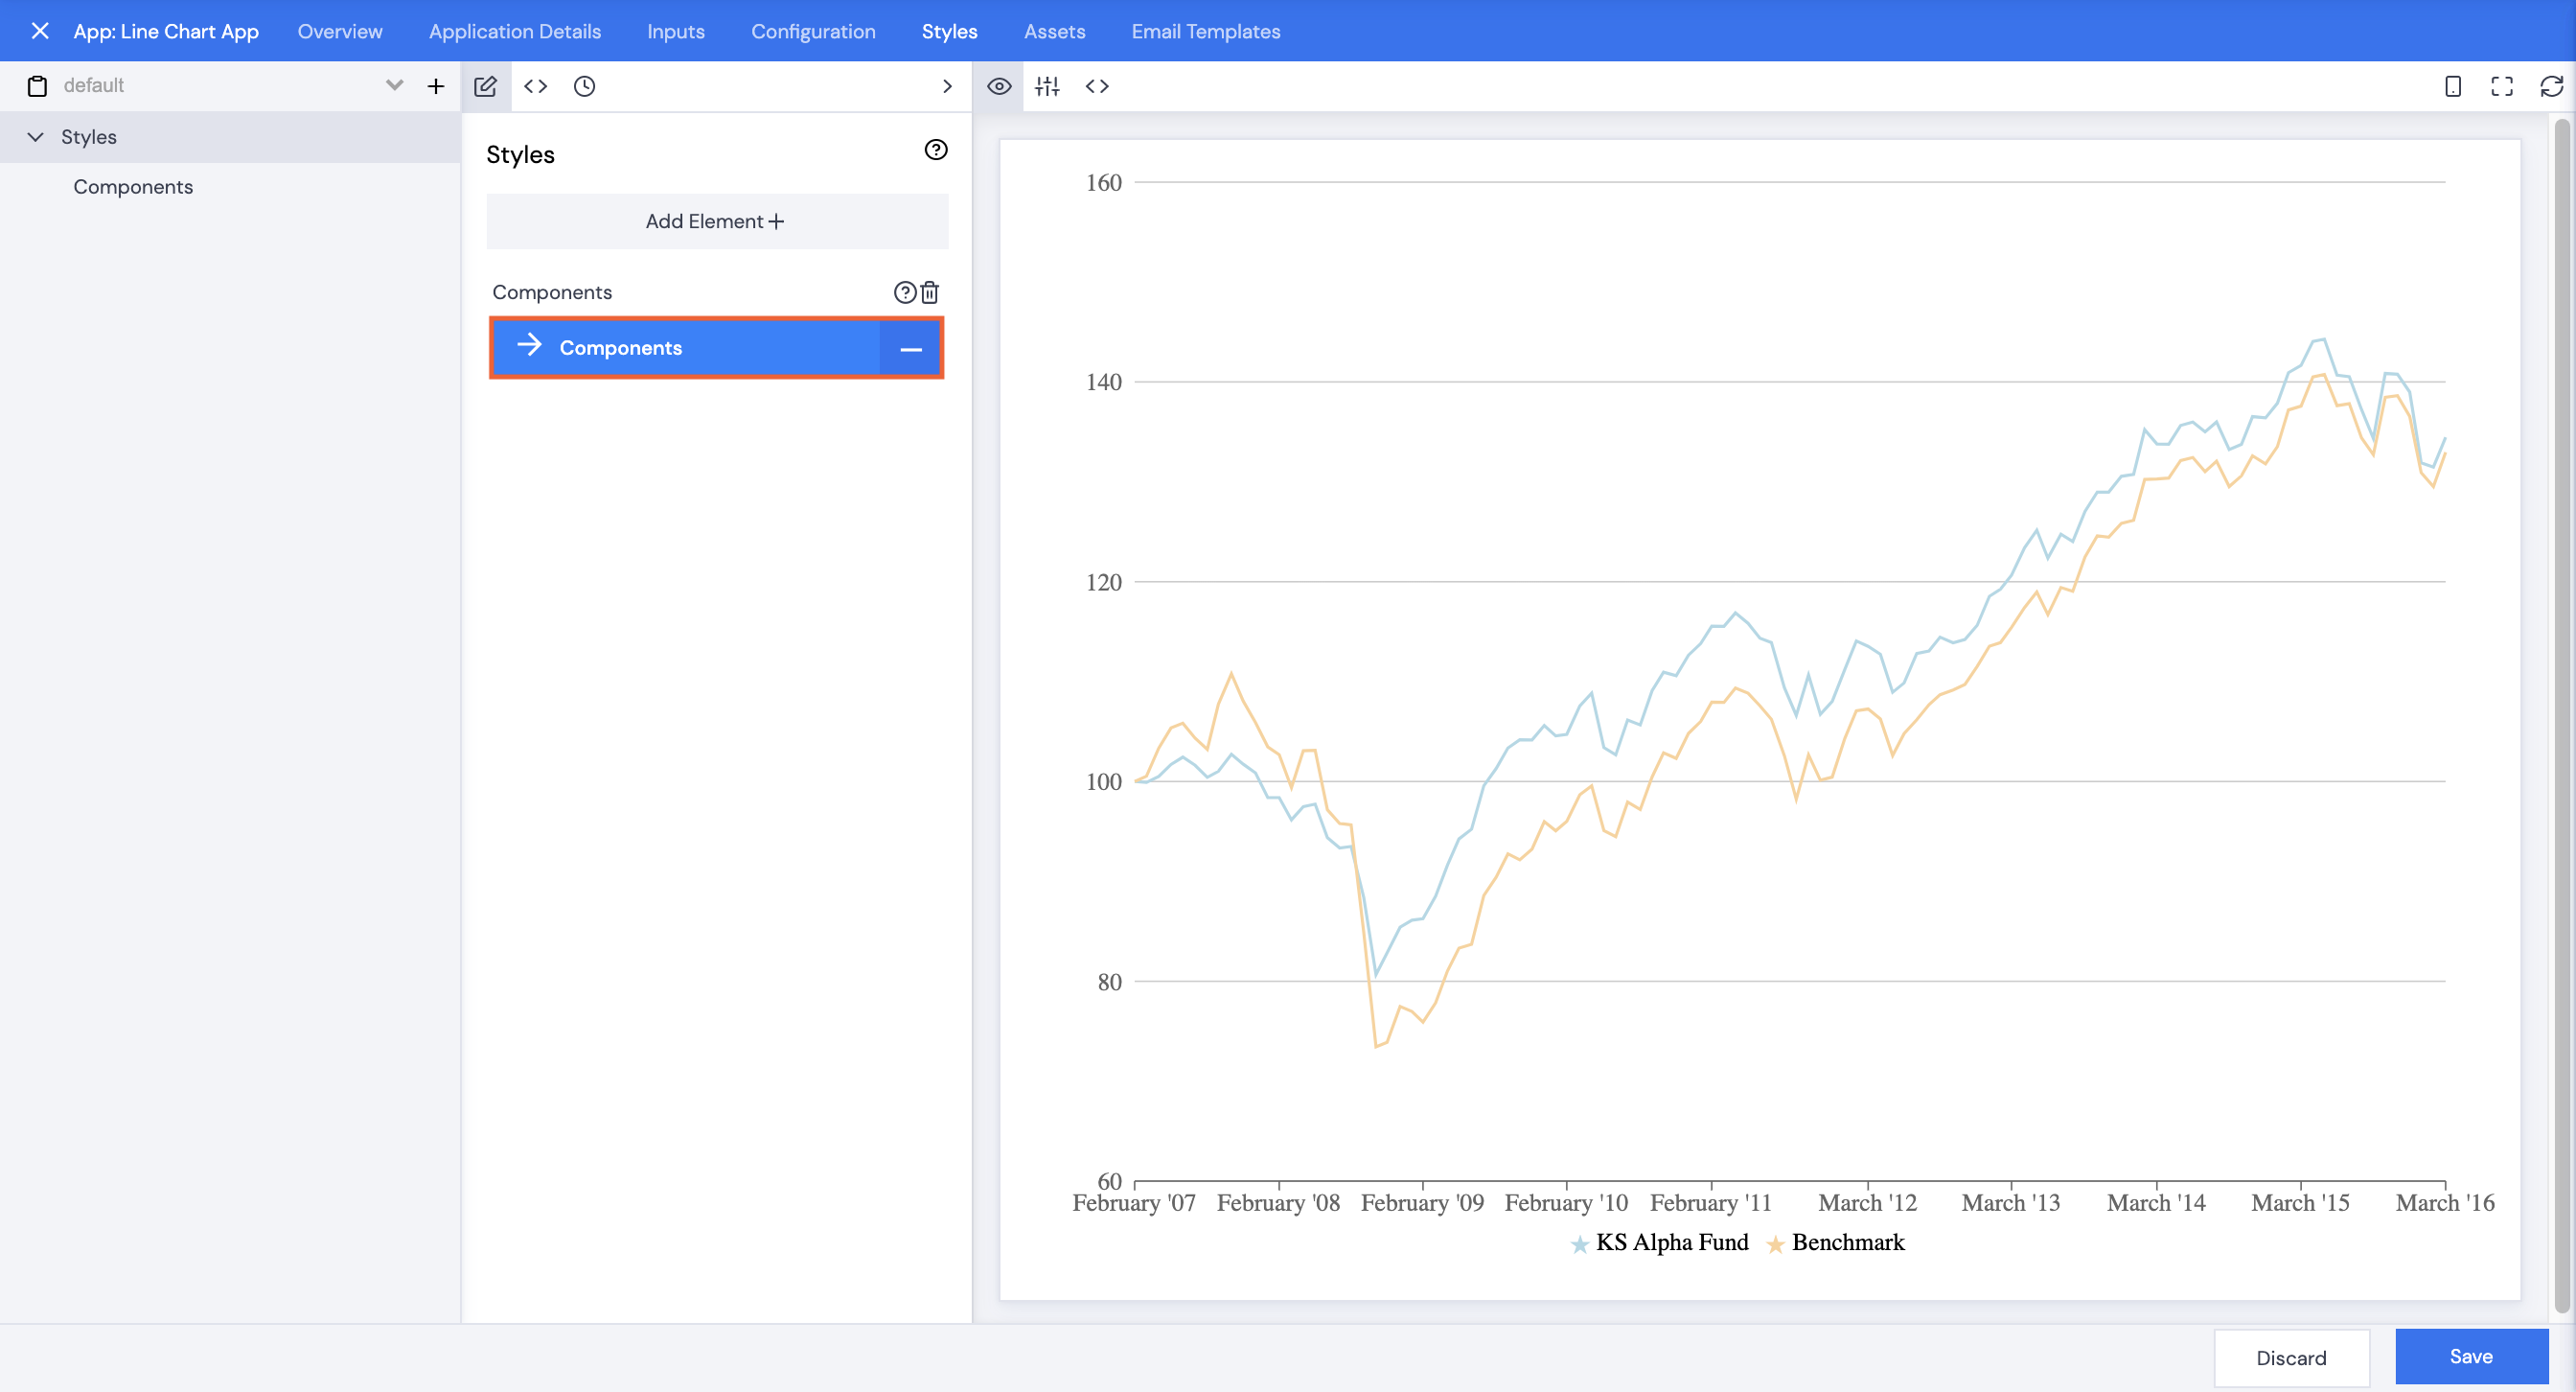
- Click Components.
- Click Add Element+.
- Select Line Chart (this will apply the same font styles to all text in the line chart app).
- Click Save.
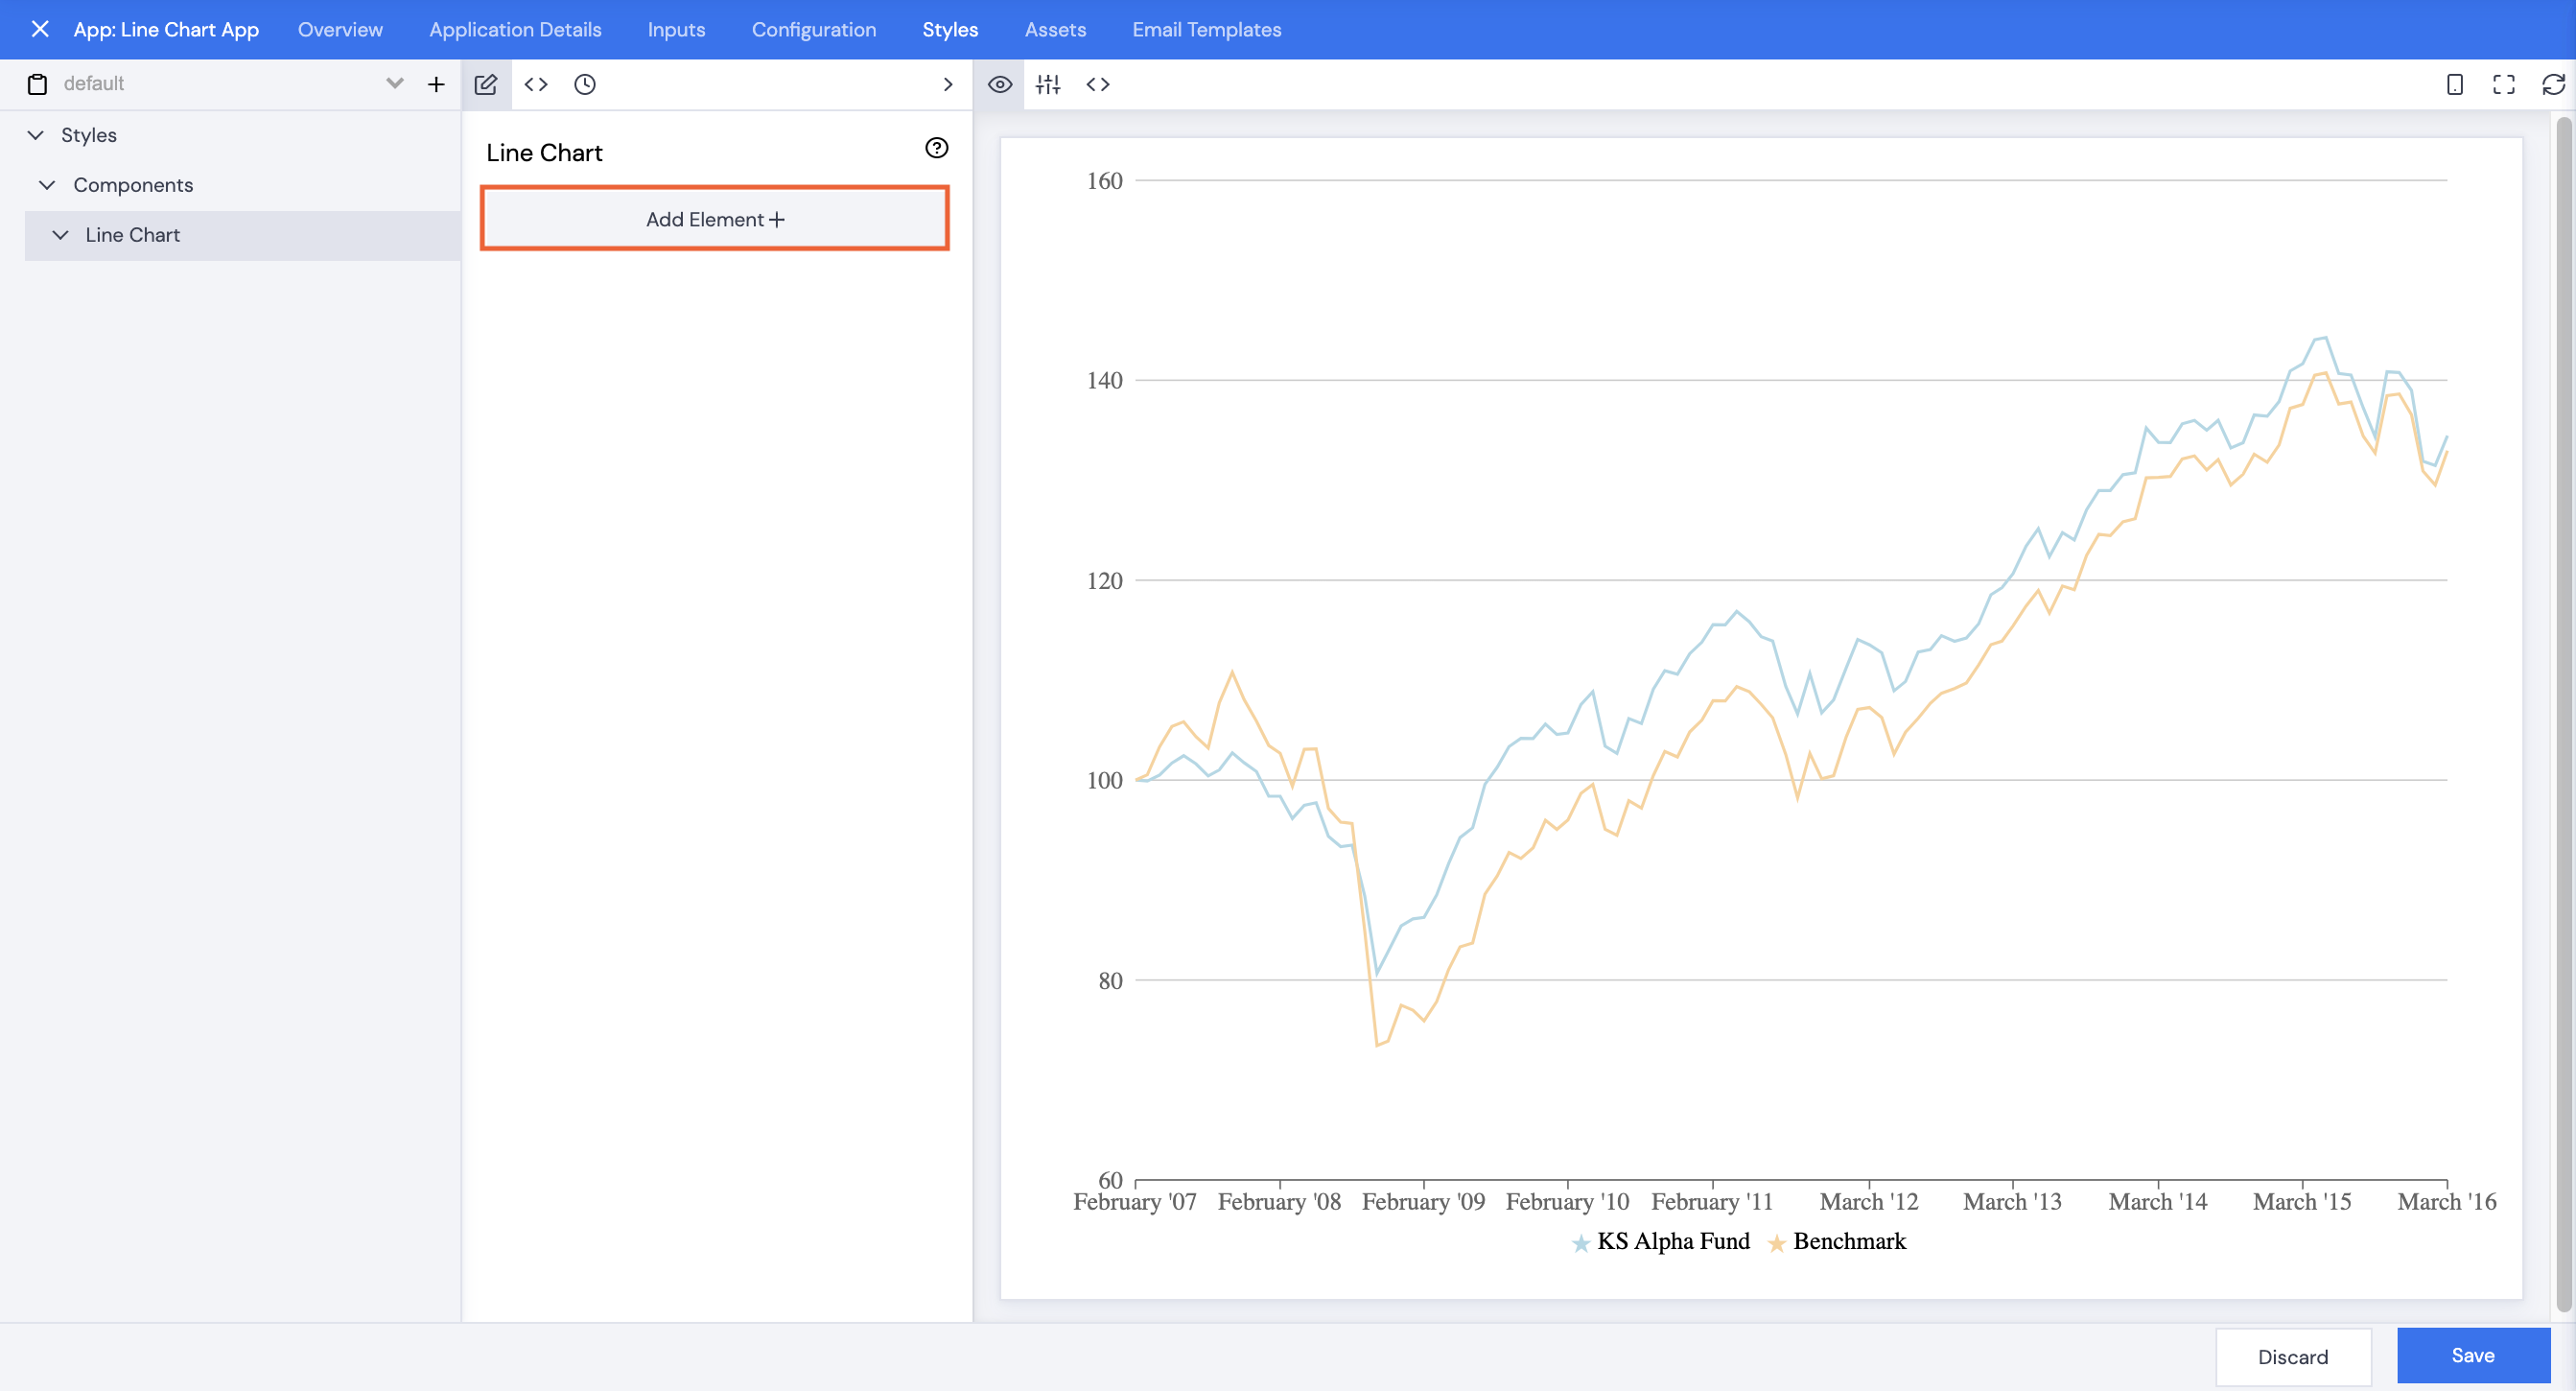
- Click Line Chart.
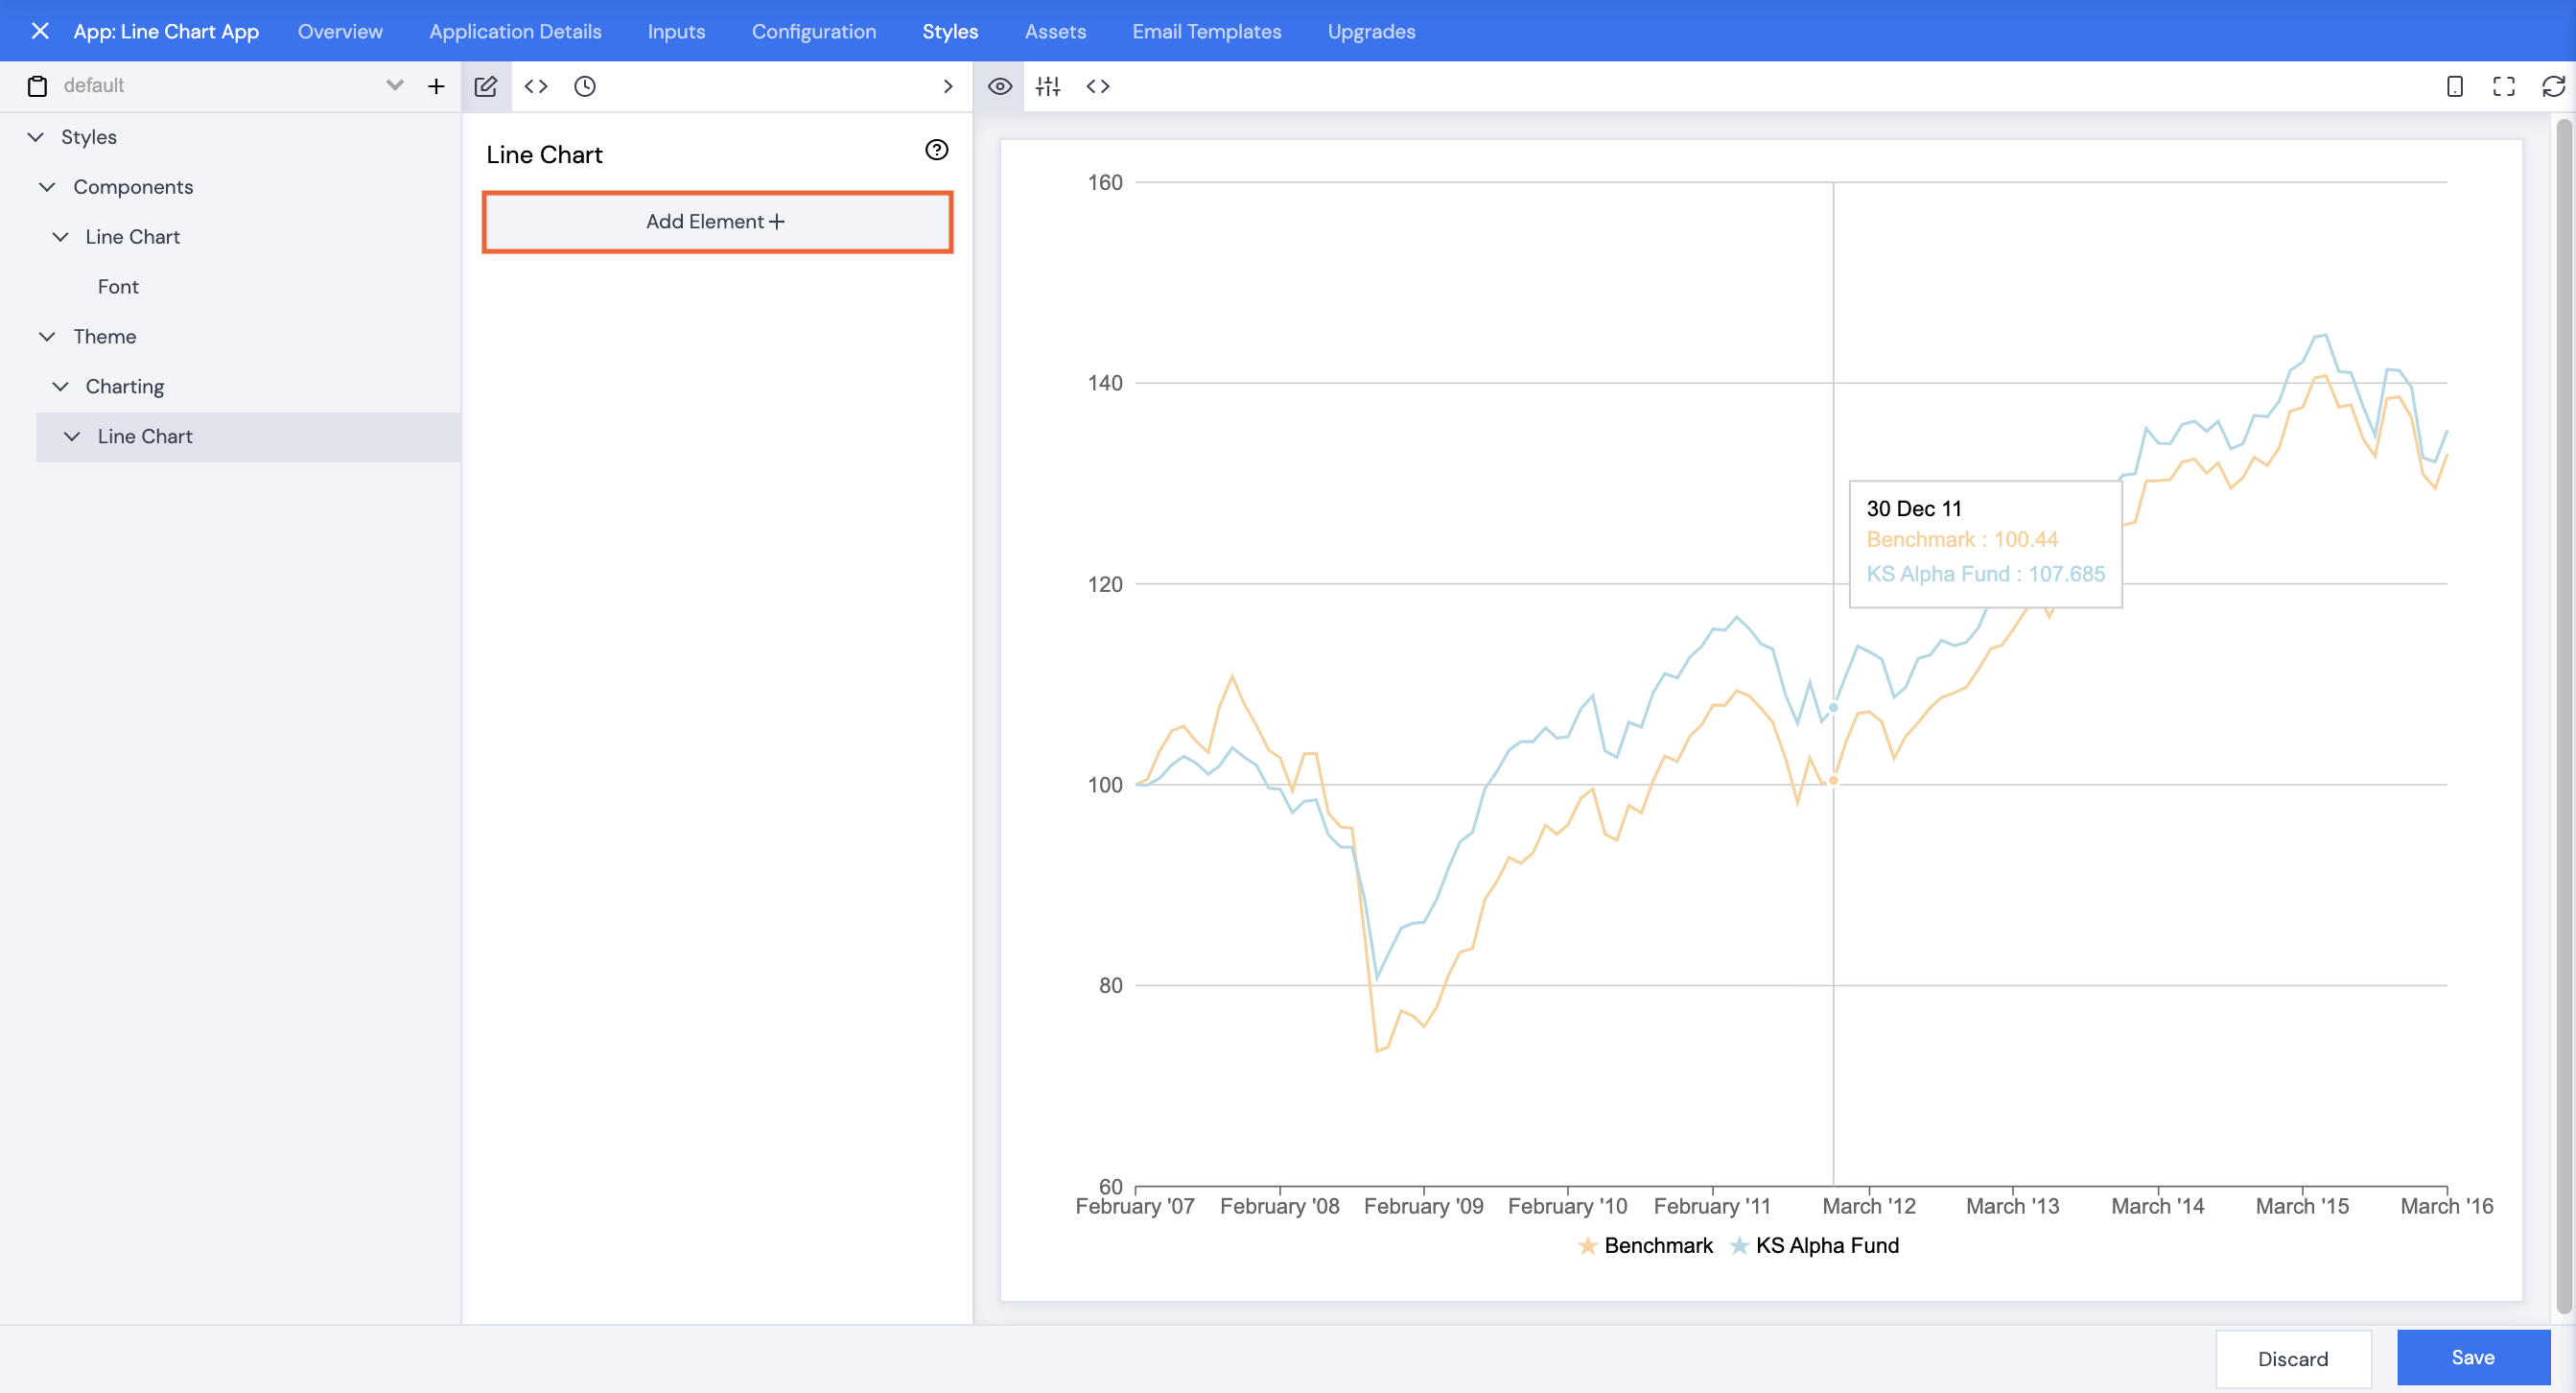
- Click Add Element+.
- Scroll or use the search bar to select Font.
- Click Save.
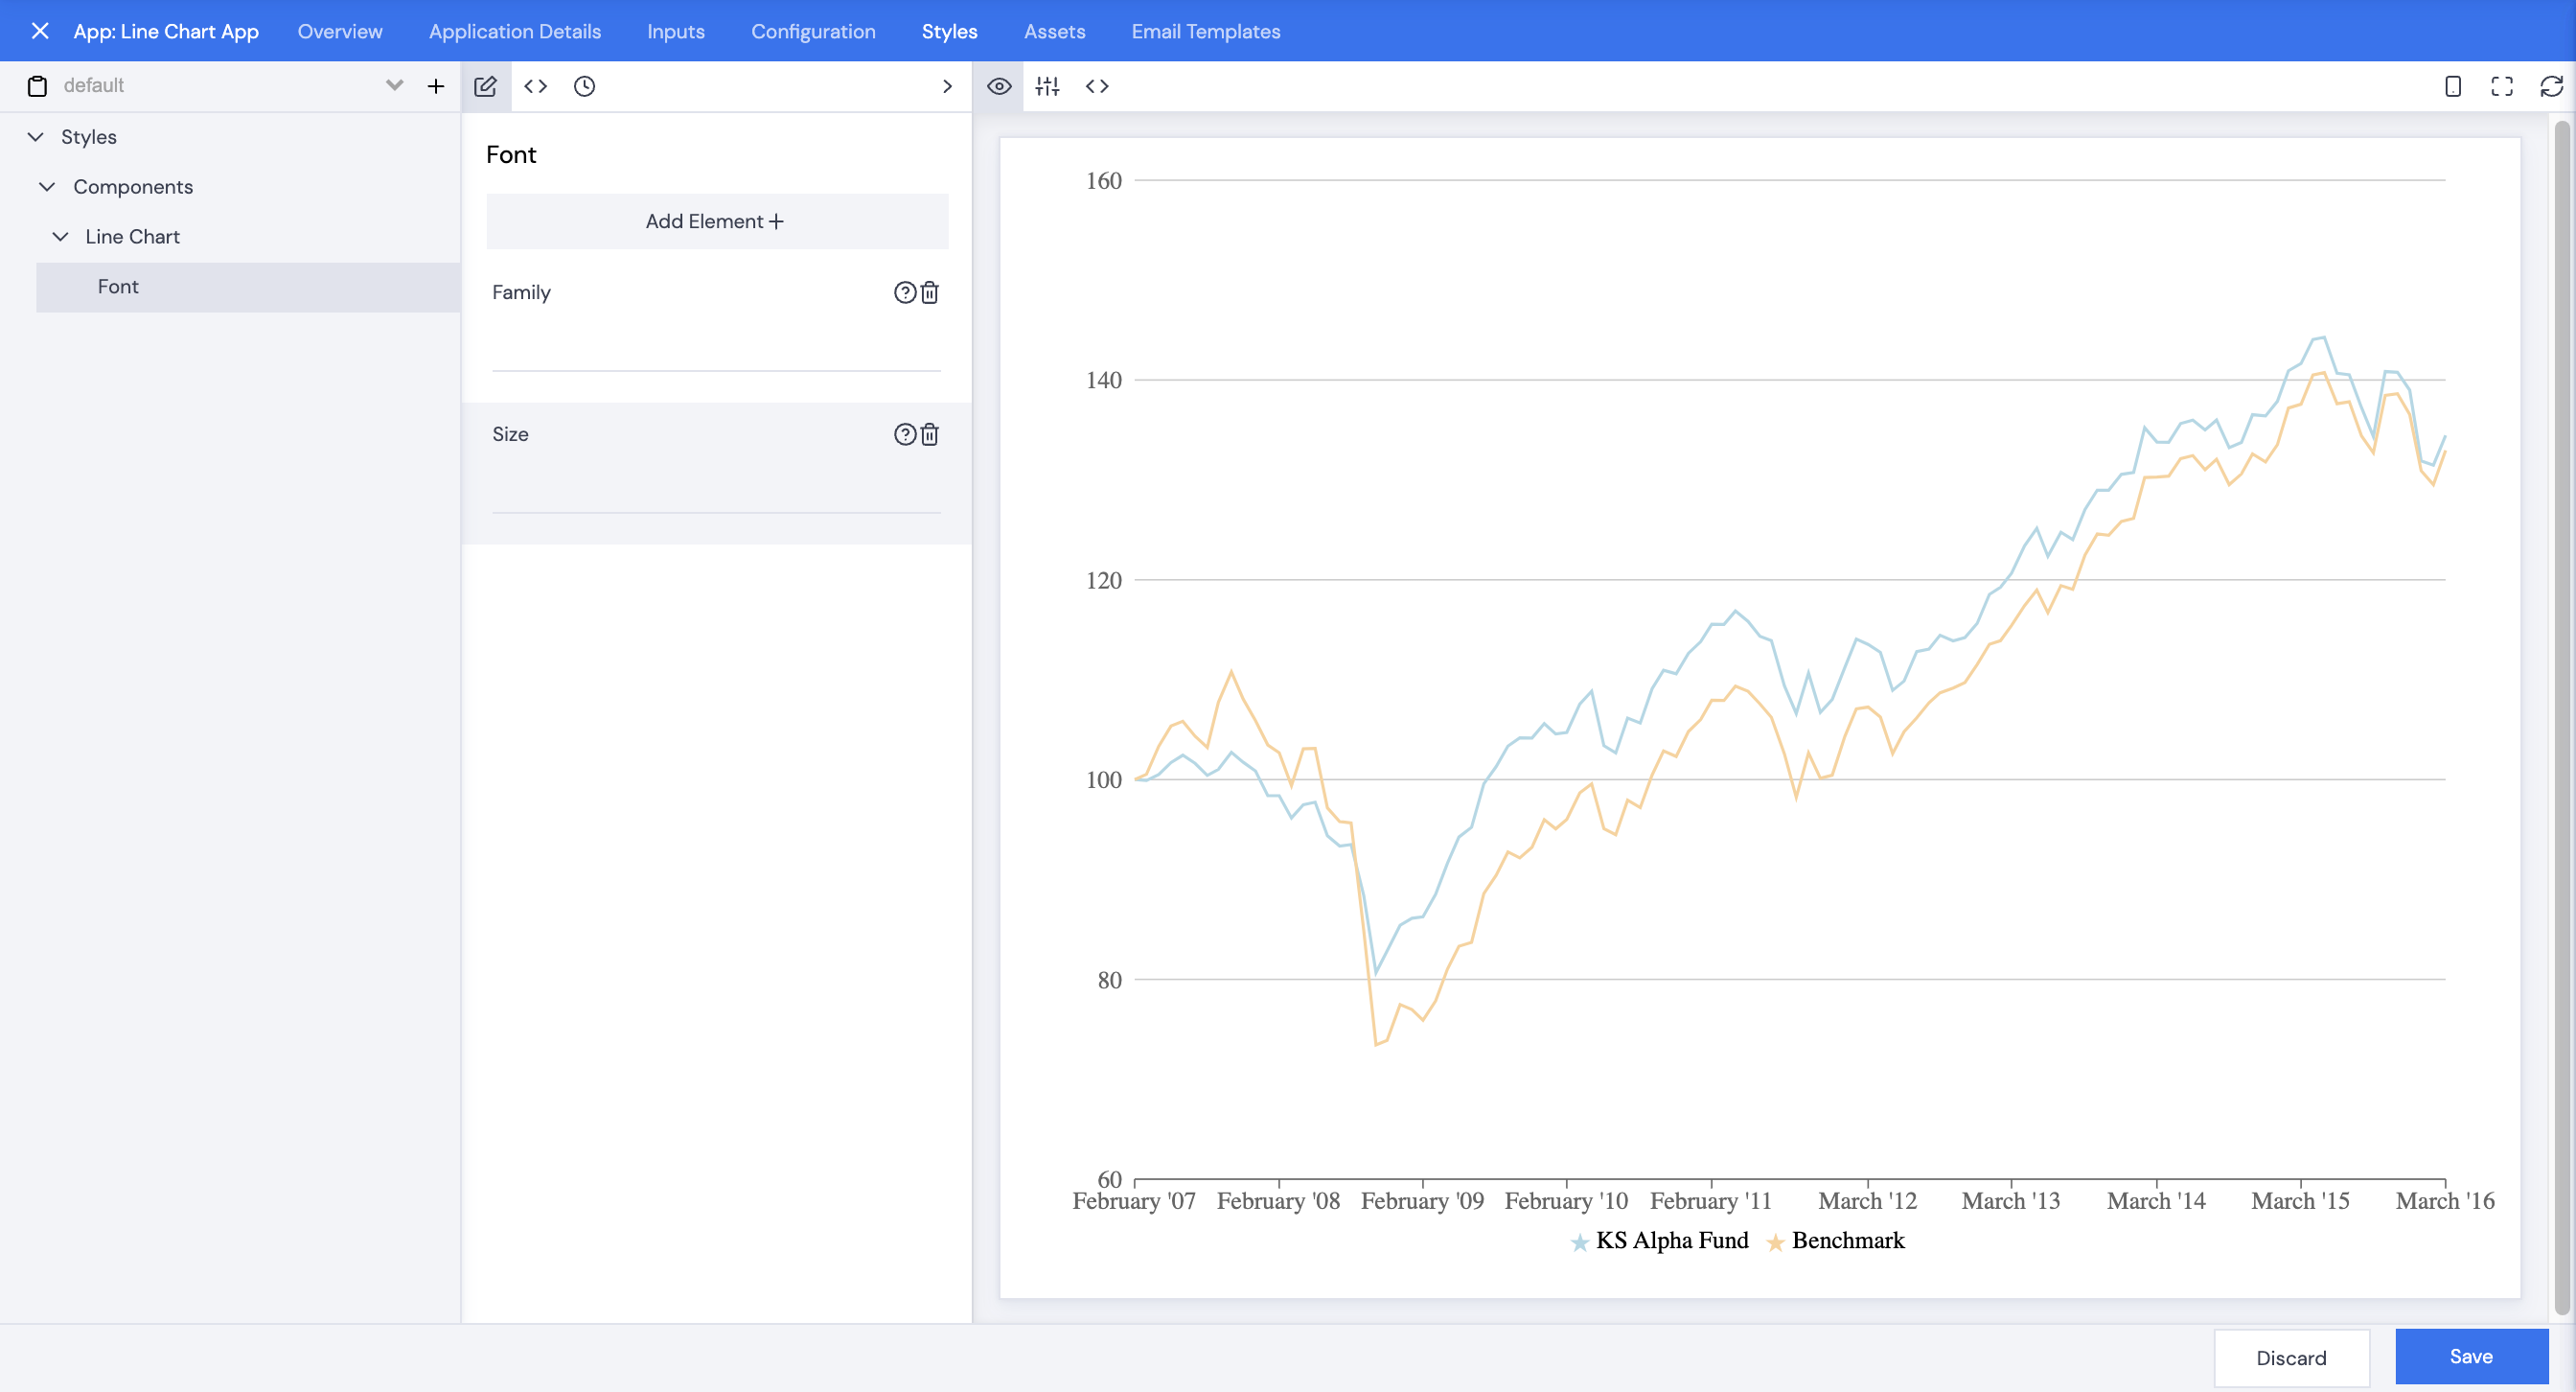
- Click Font.
- Click Add Element+.
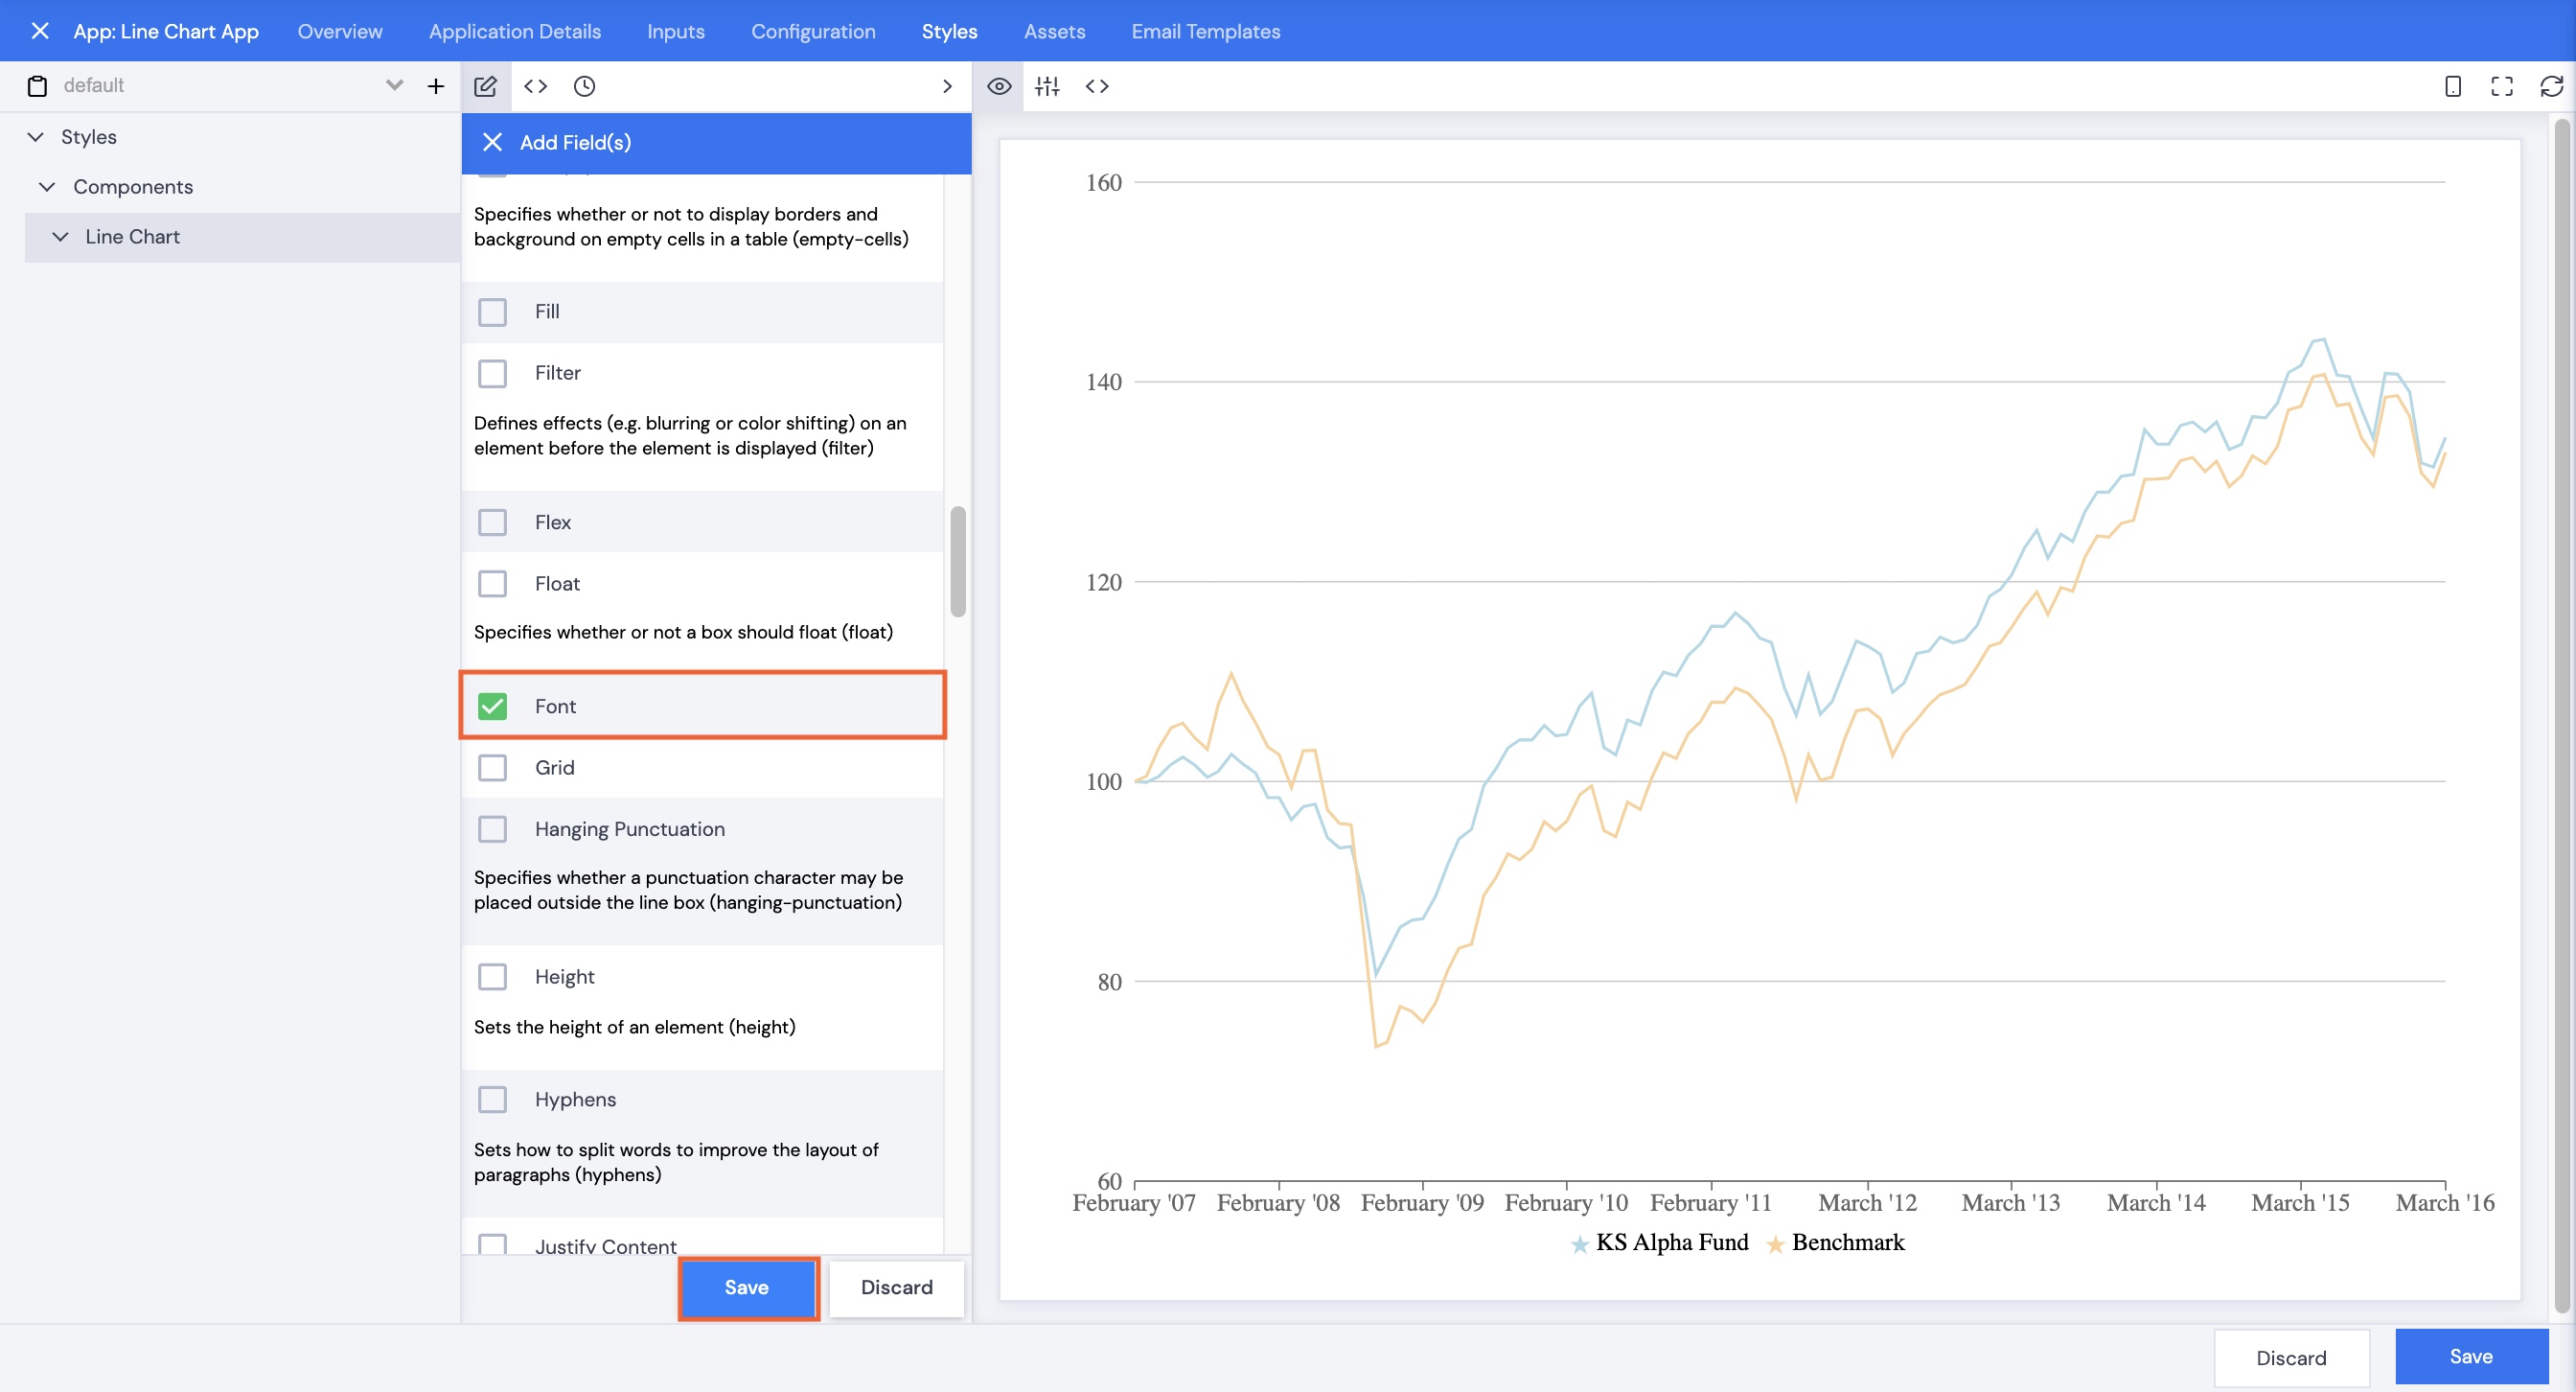
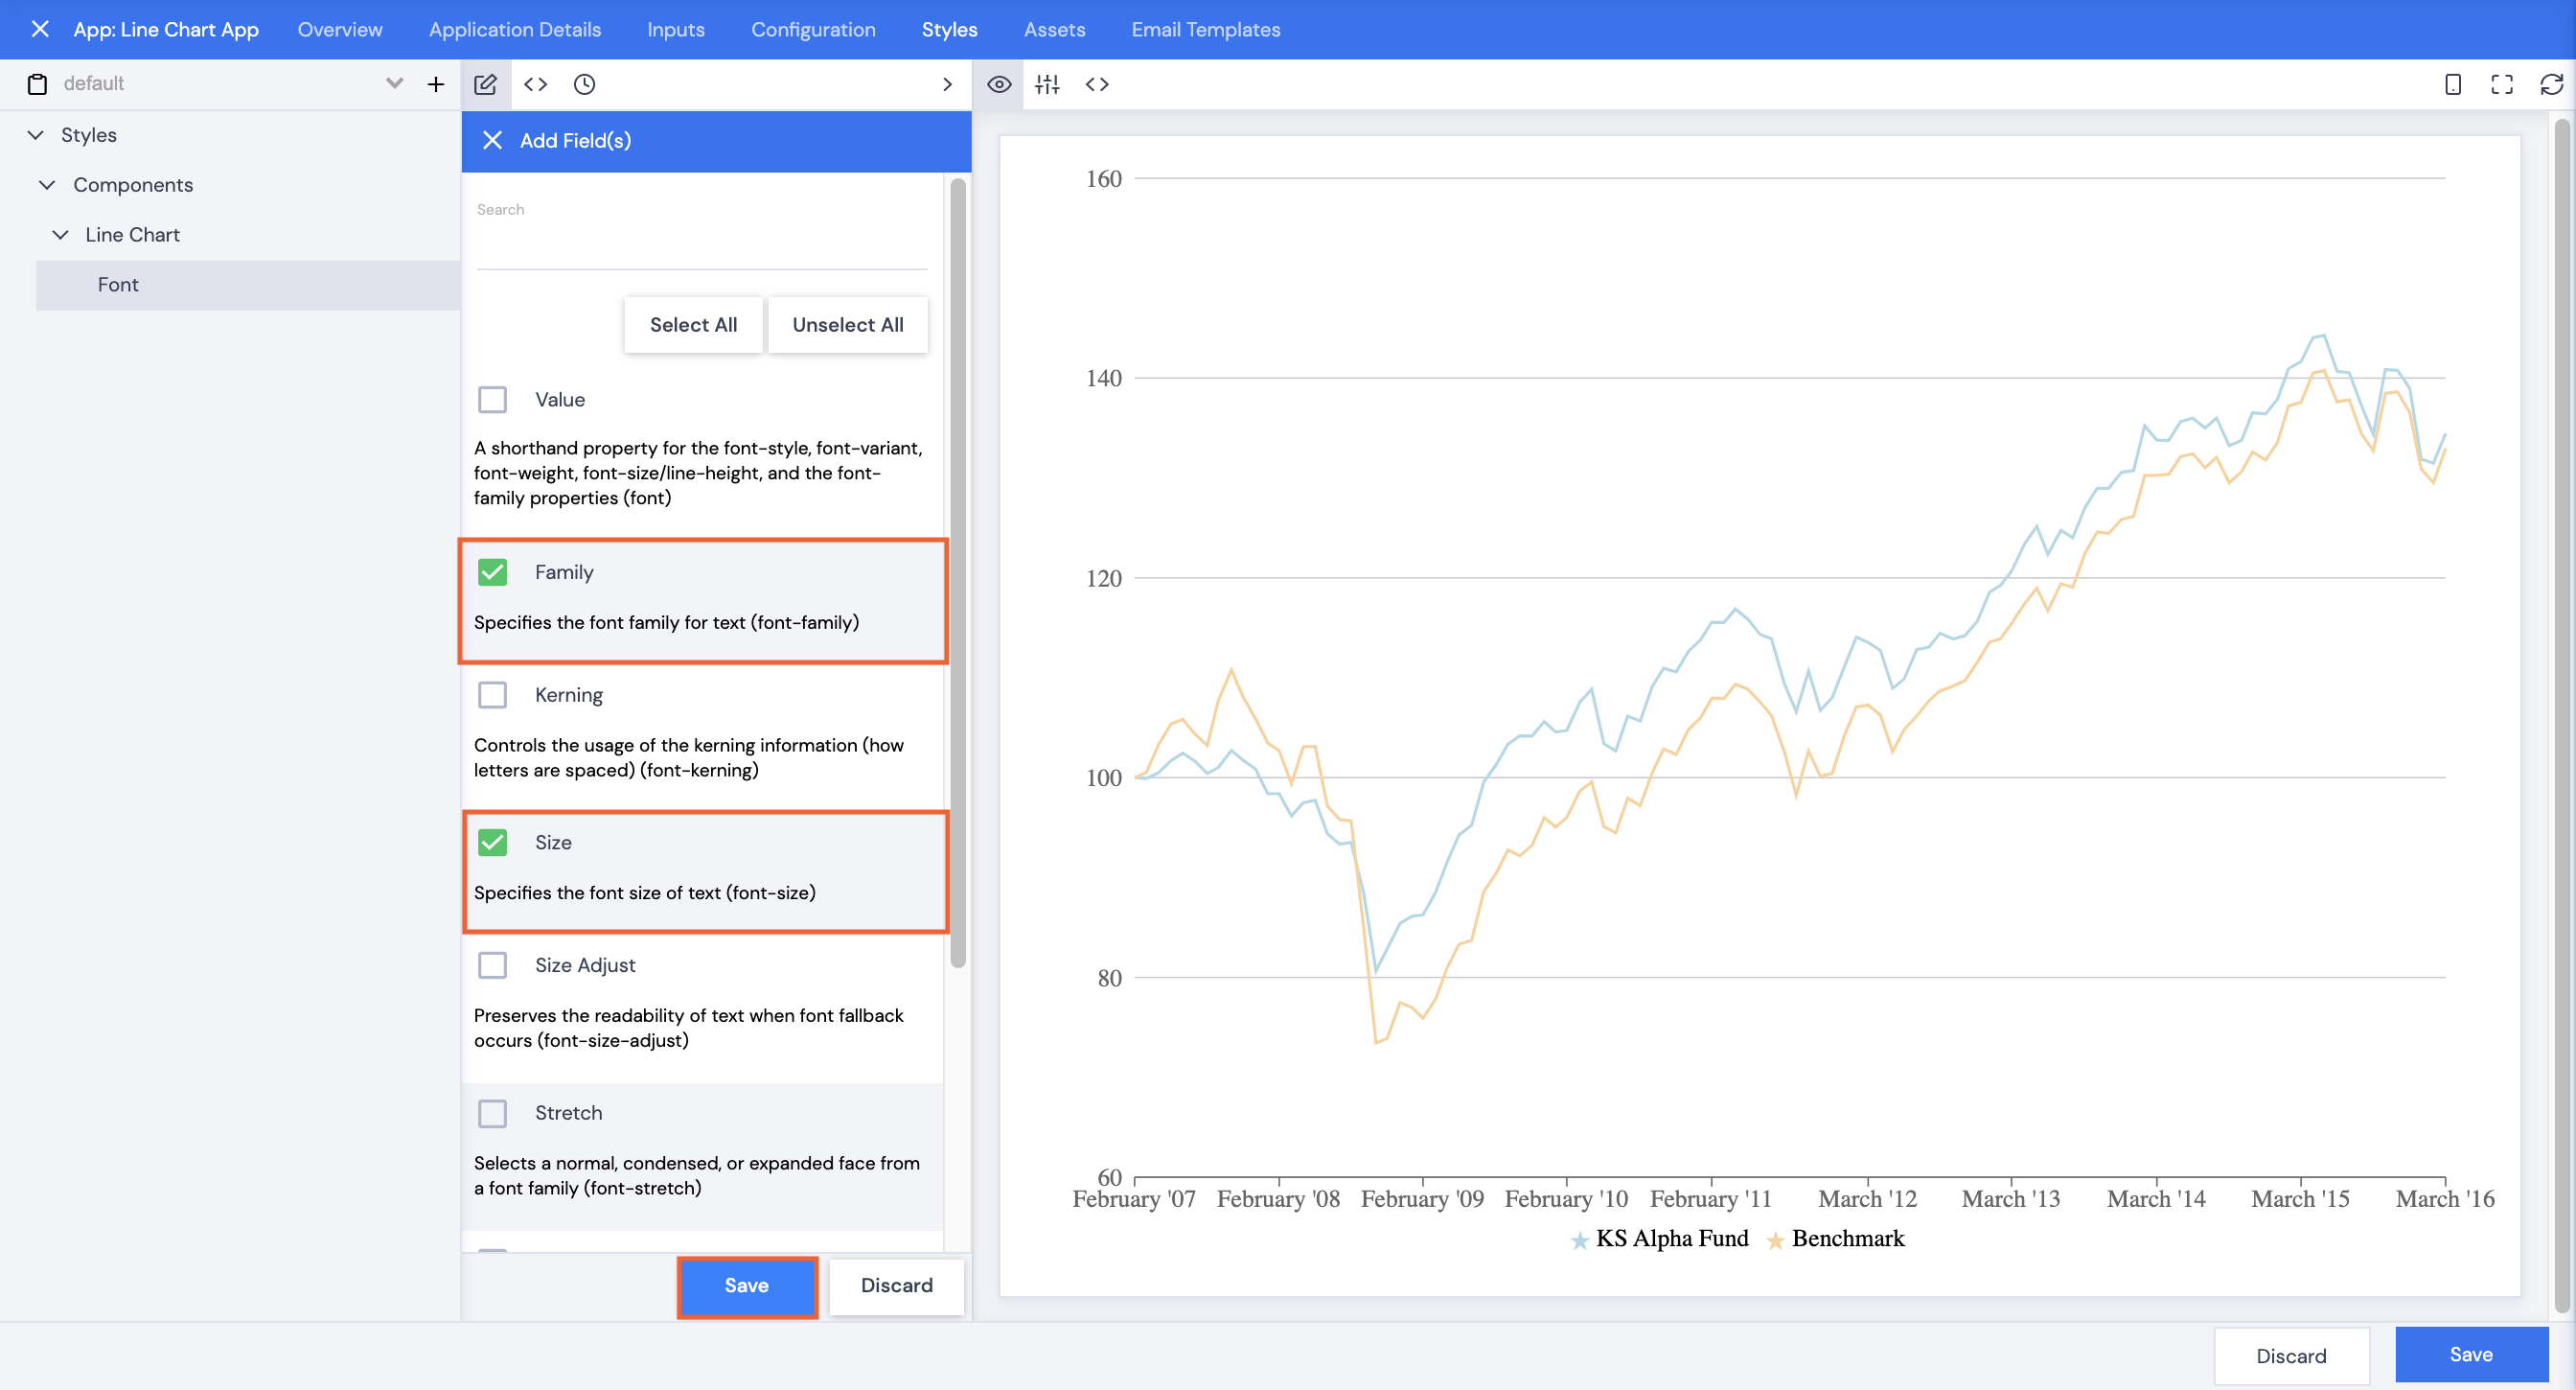
- Scroll down or use the search bar to select Family and Size.
- Click Save.
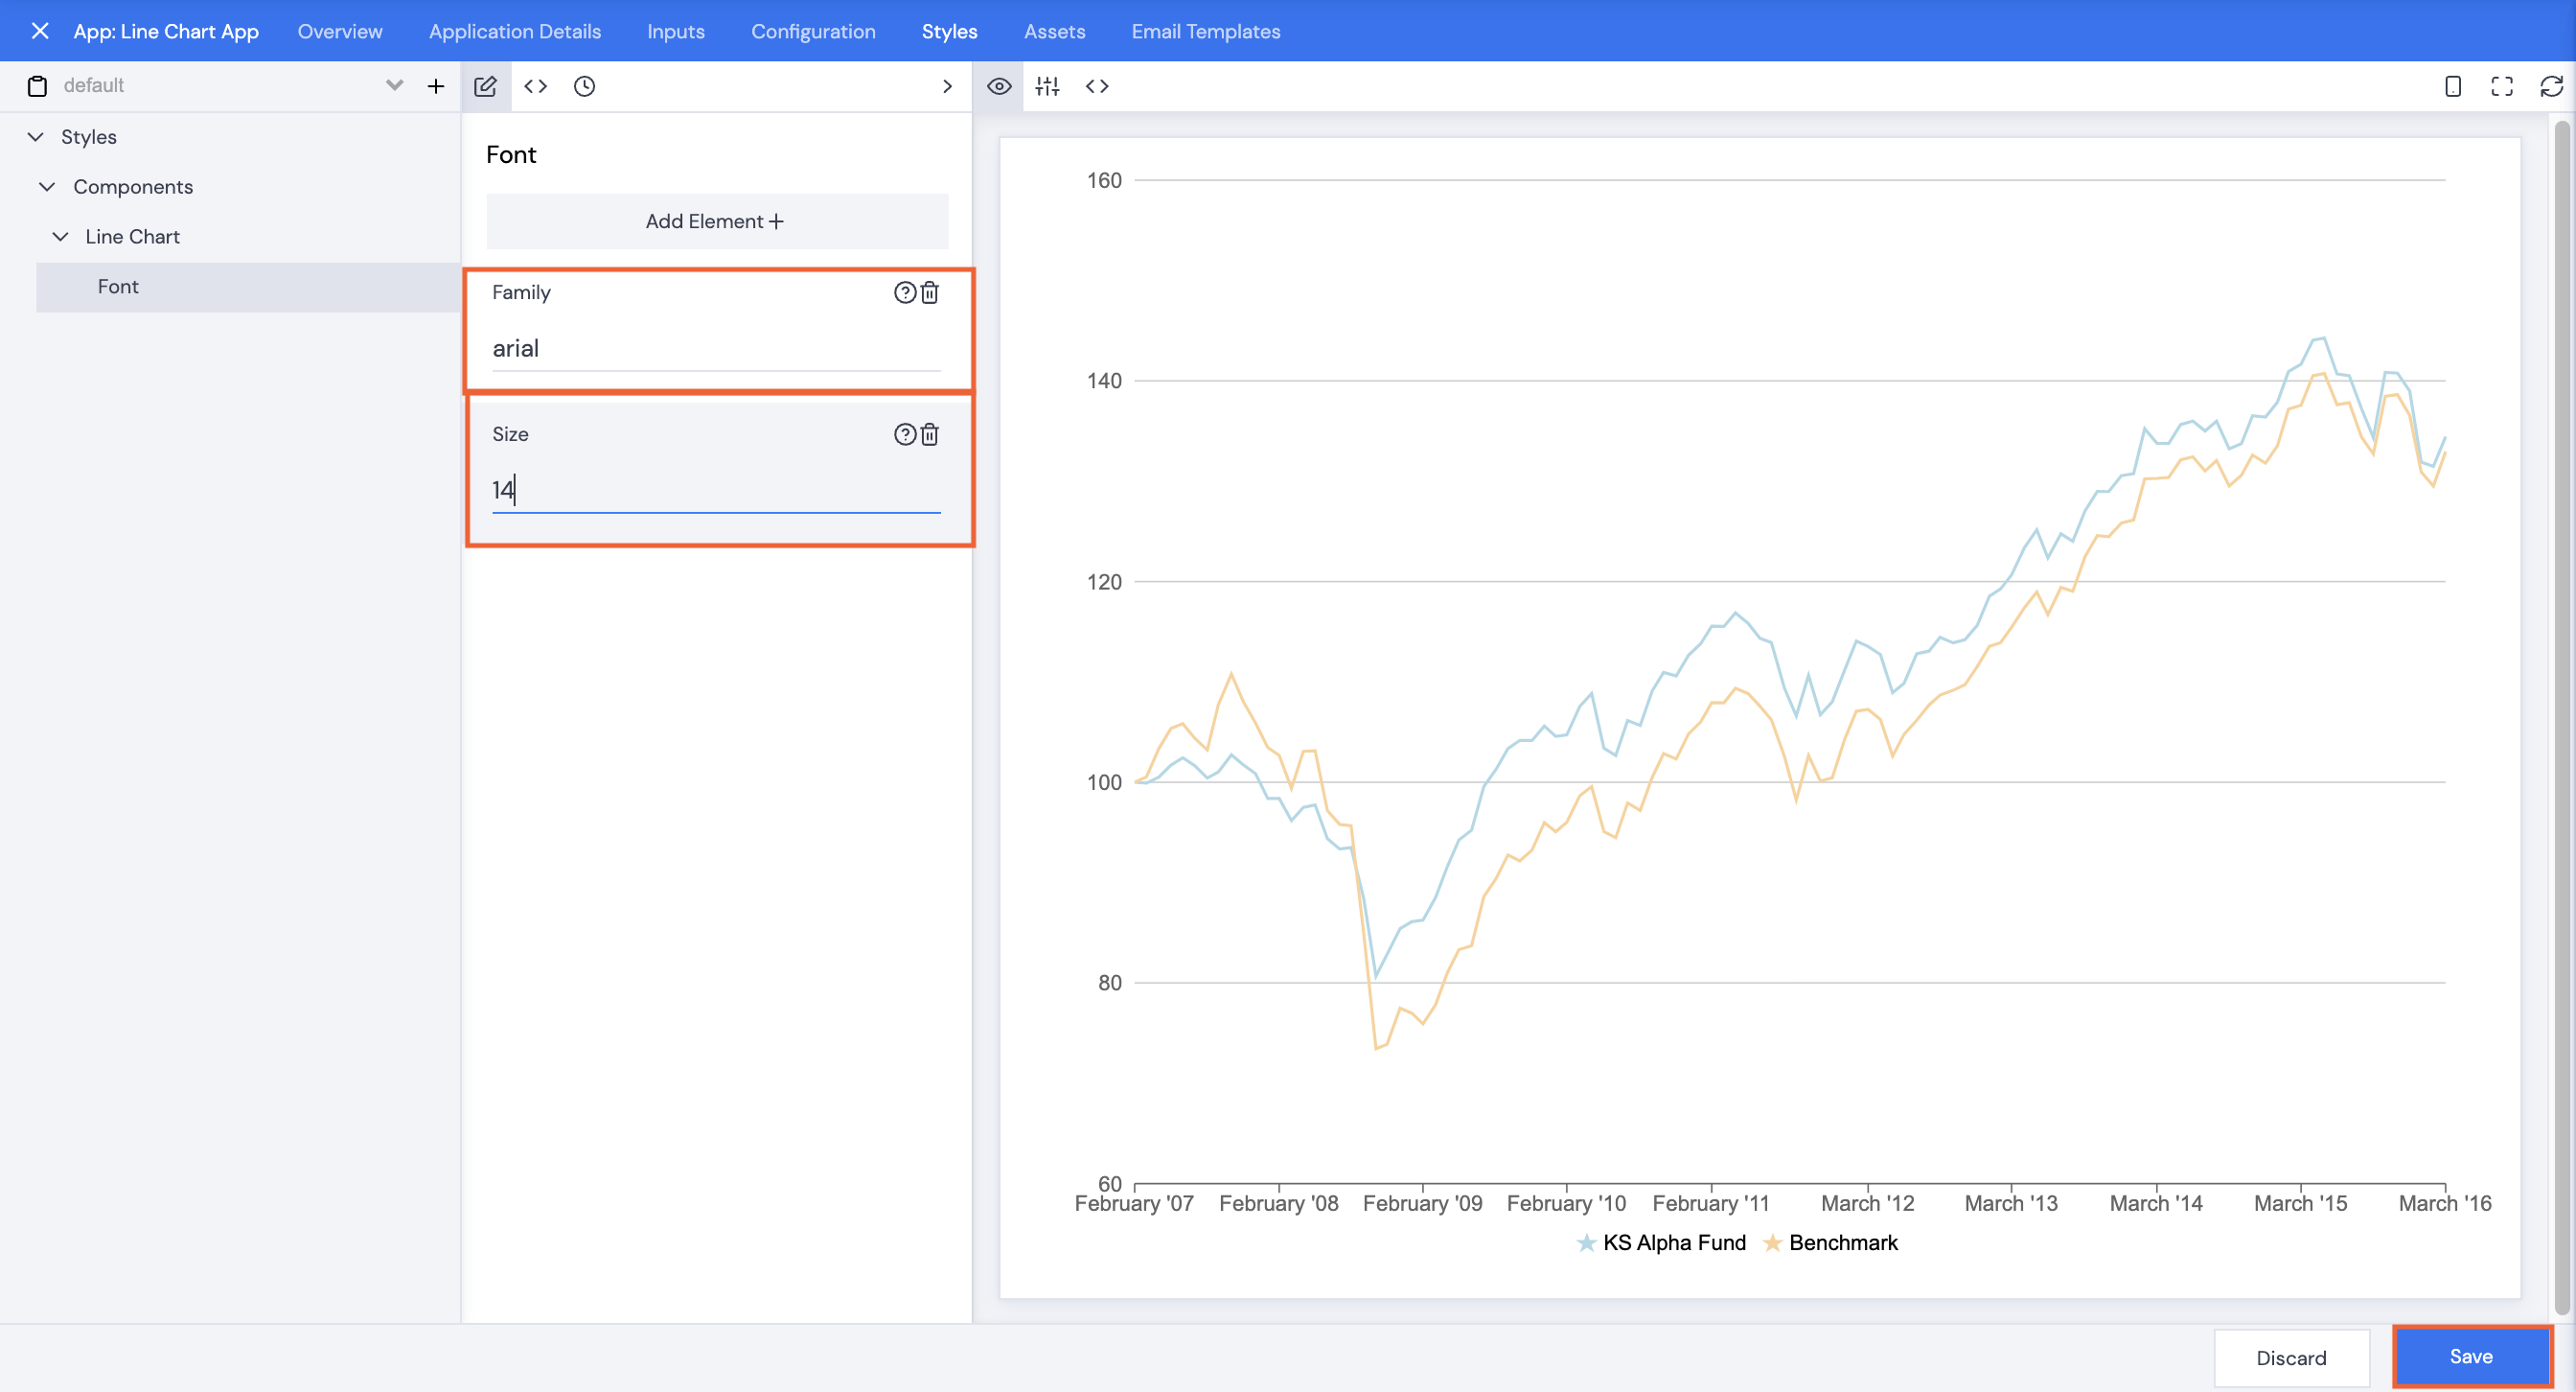
- Type in a font Family.
- Type in a font Size.
- Click Save.
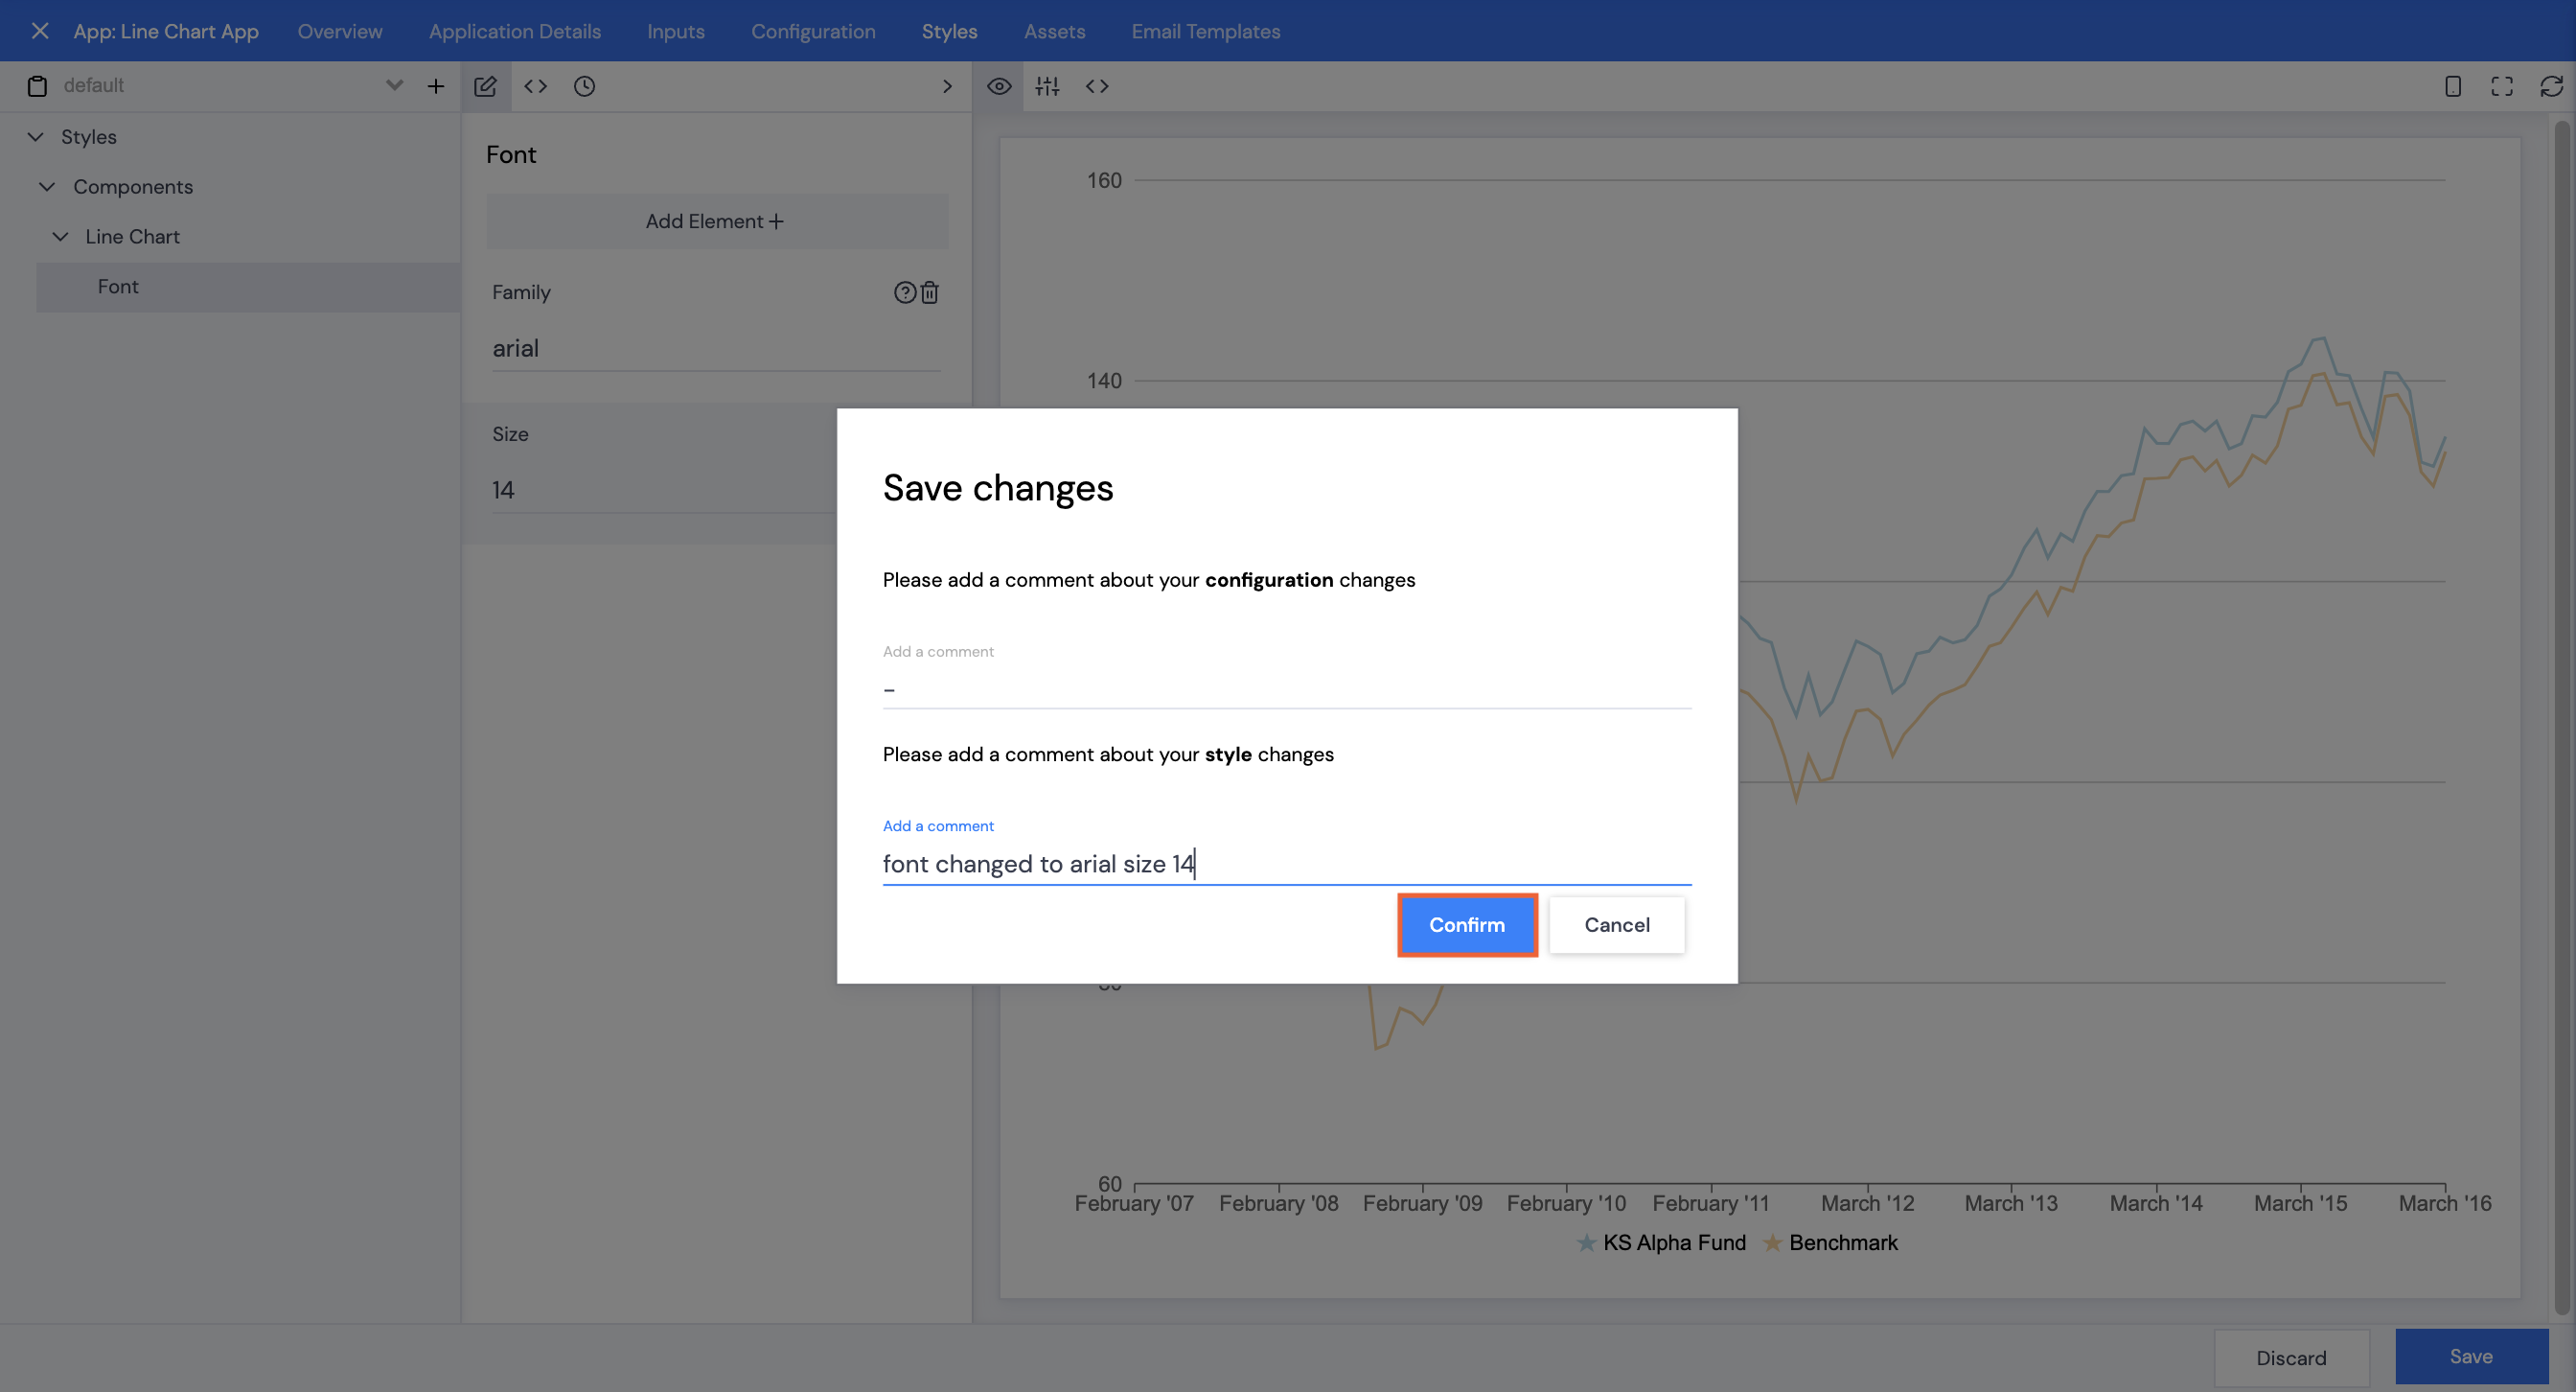
- Type in a comment, then click Confirm.
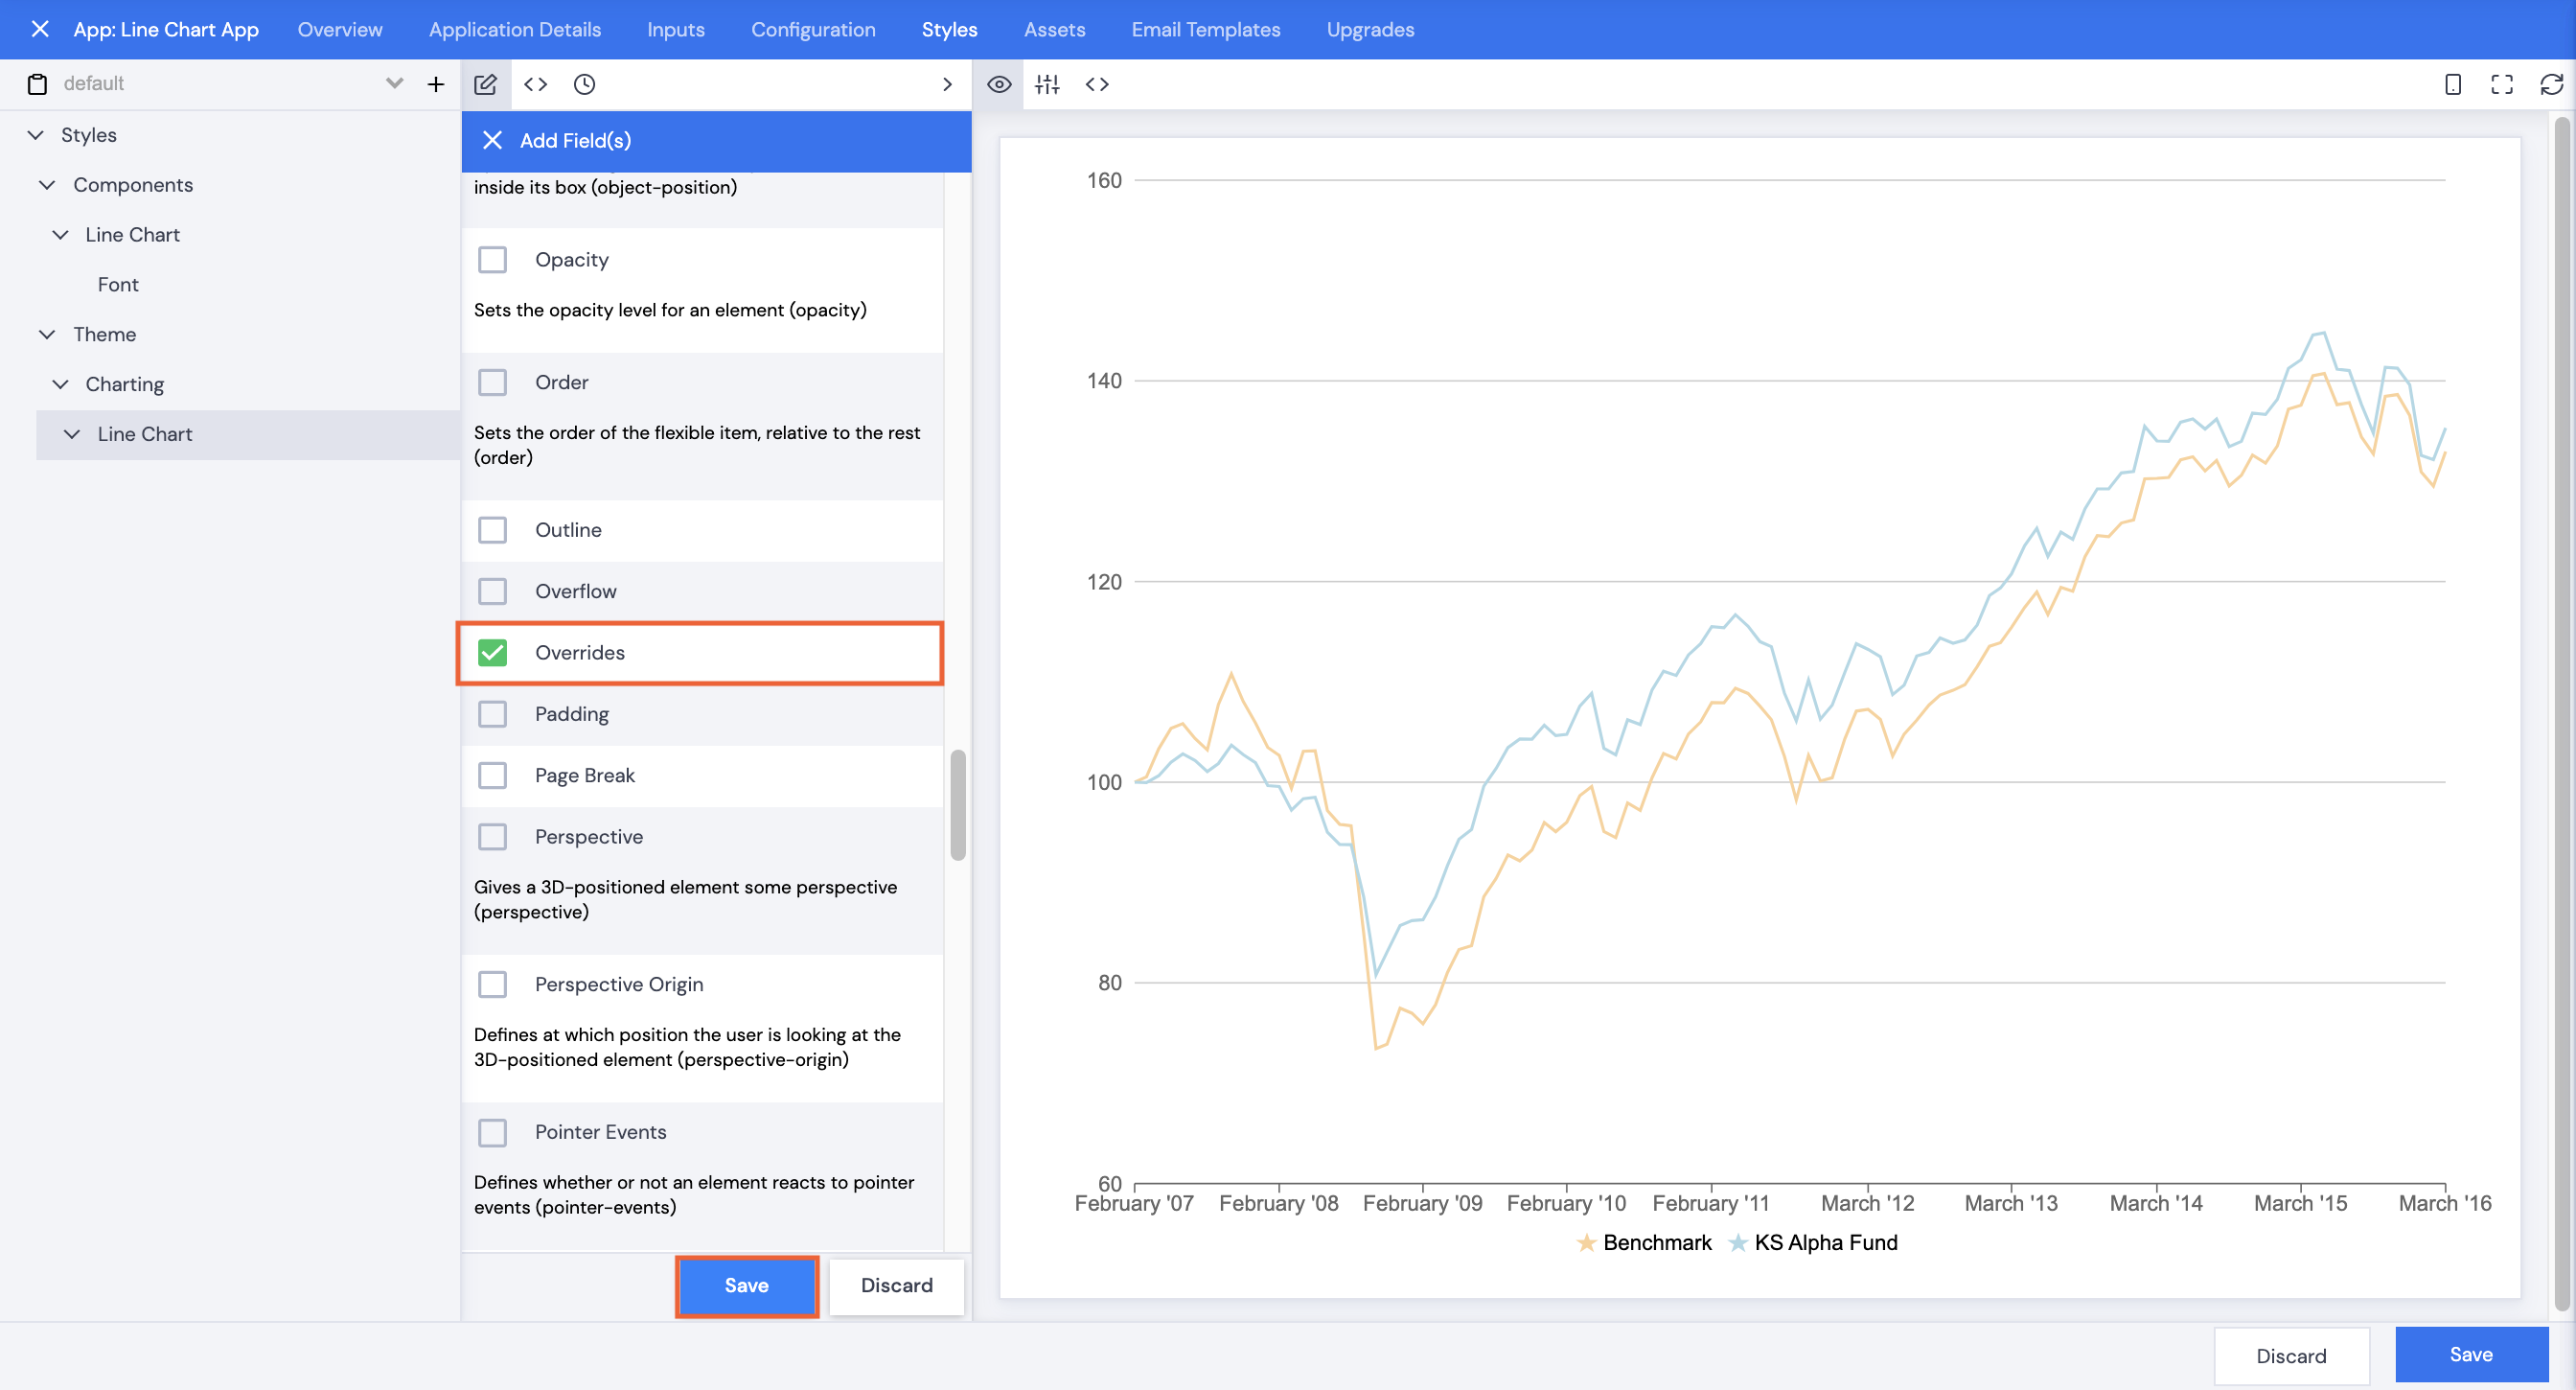
Tooltip Background
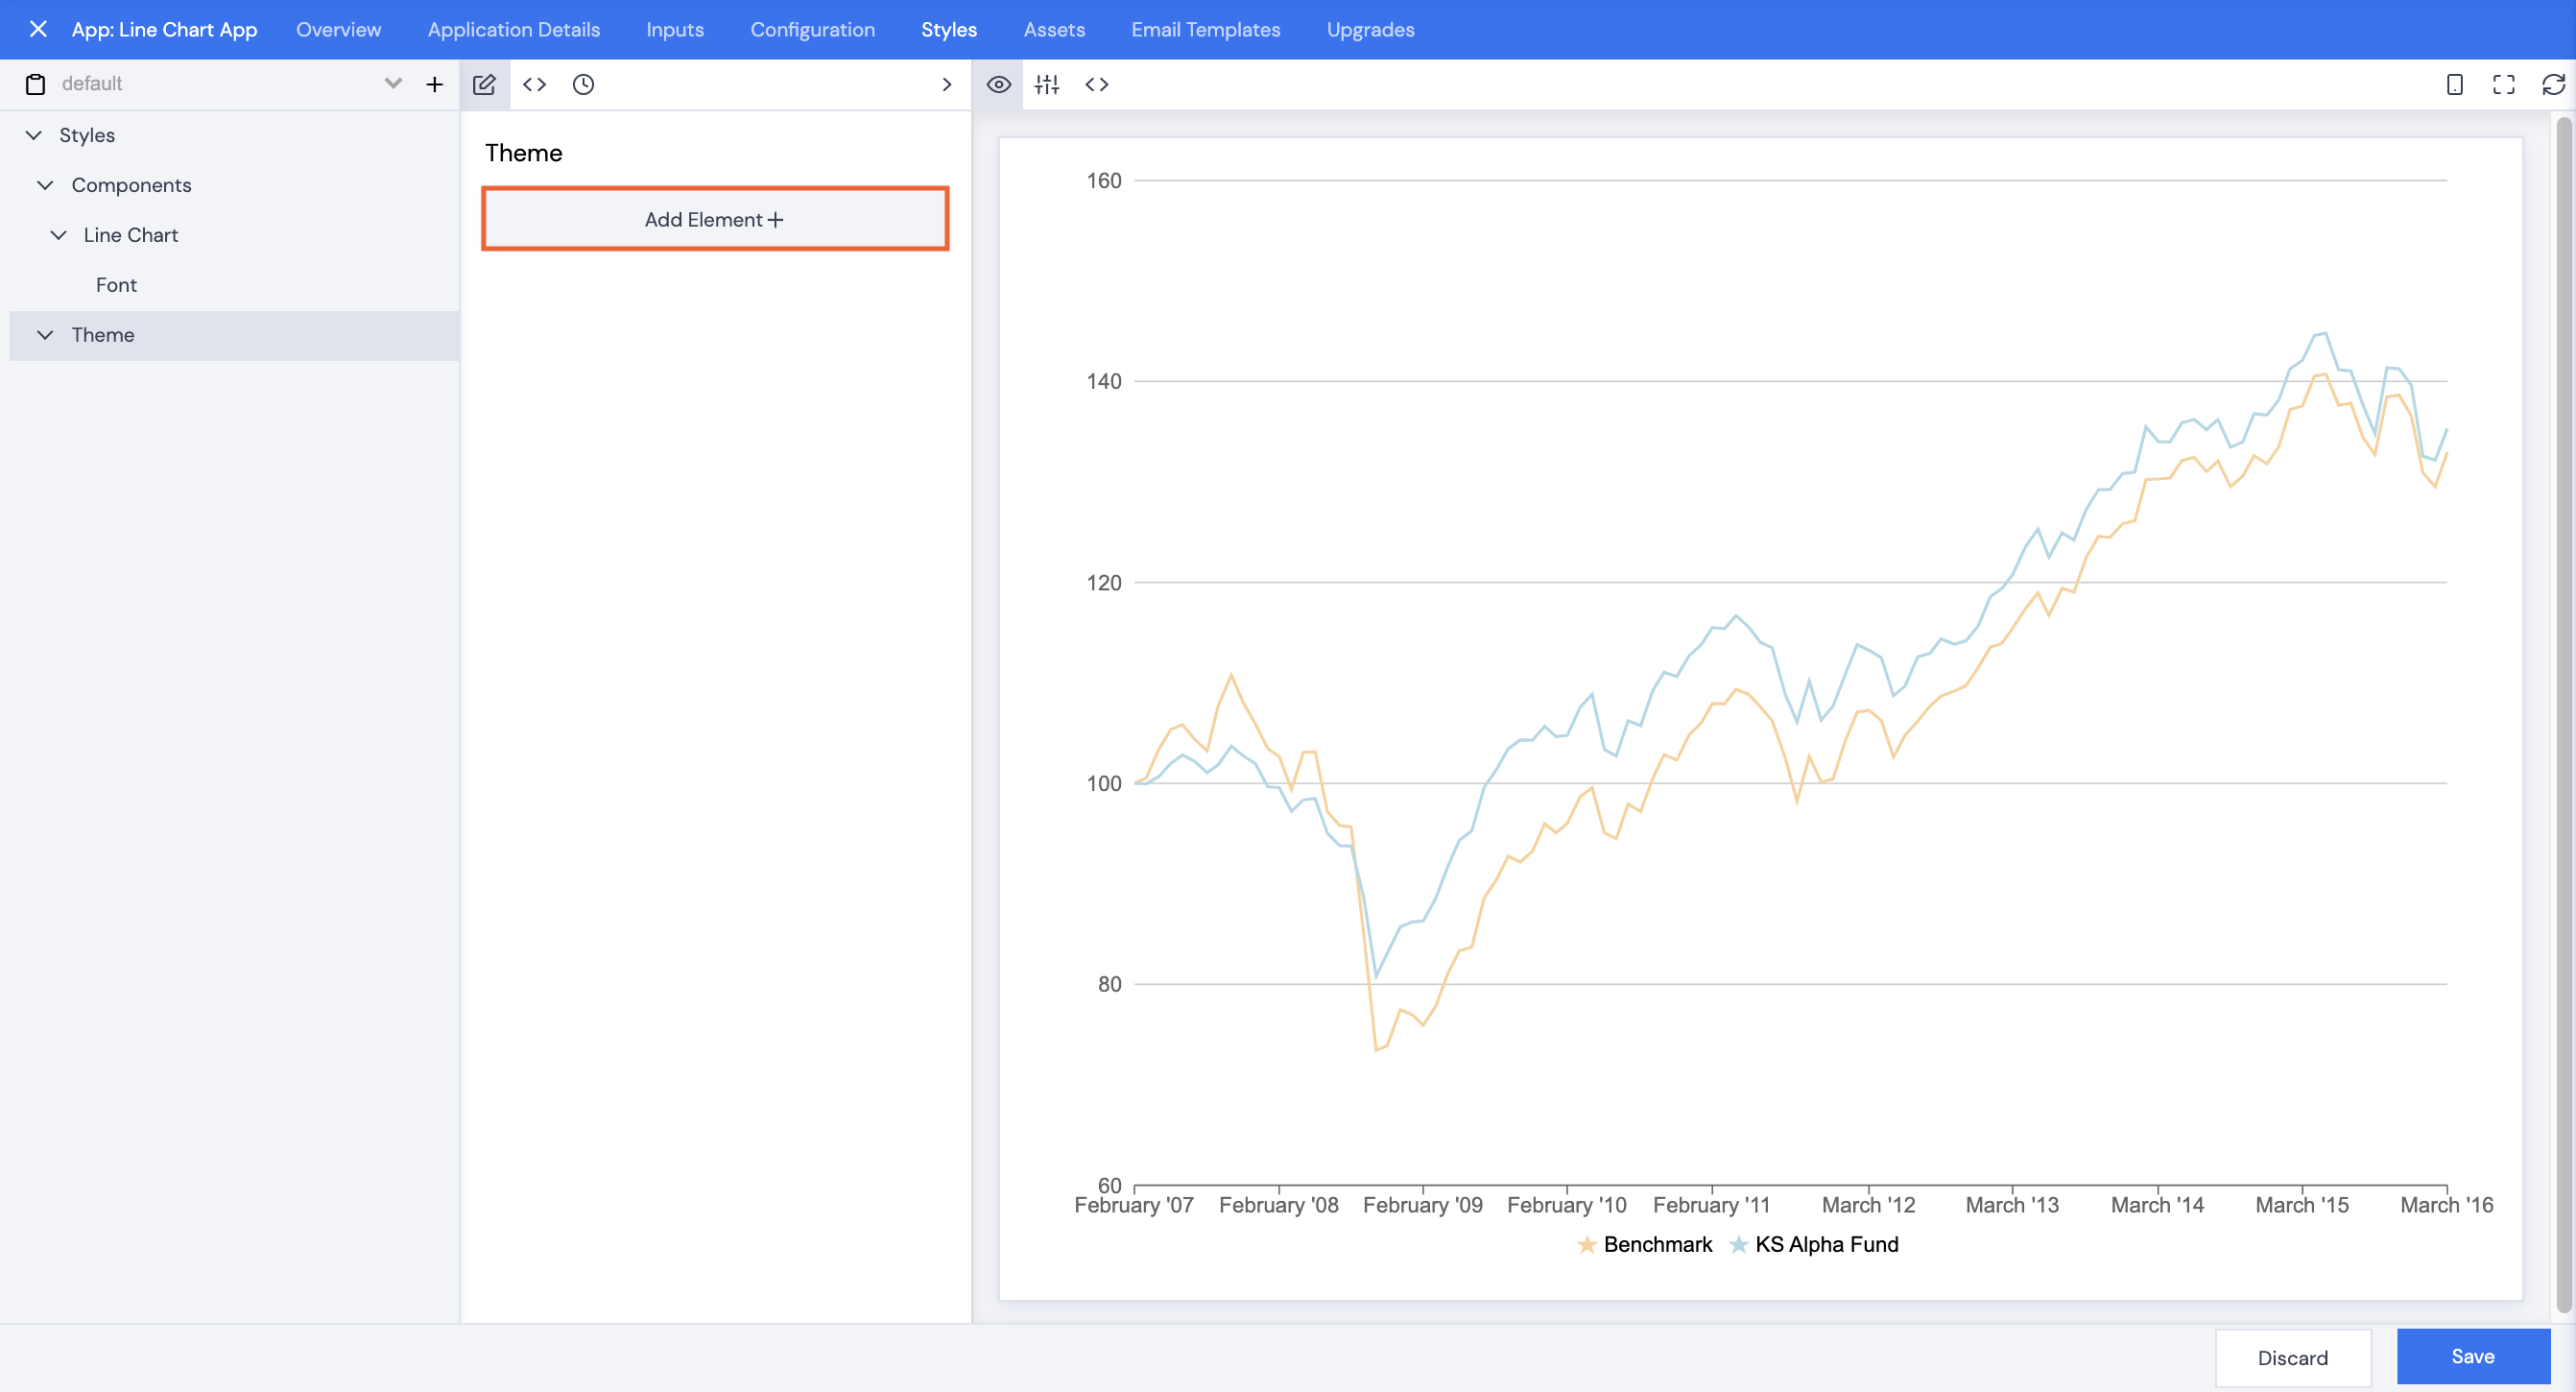
- With the Style tab selected, click Add Element+.
- Select Theme, then click Save.
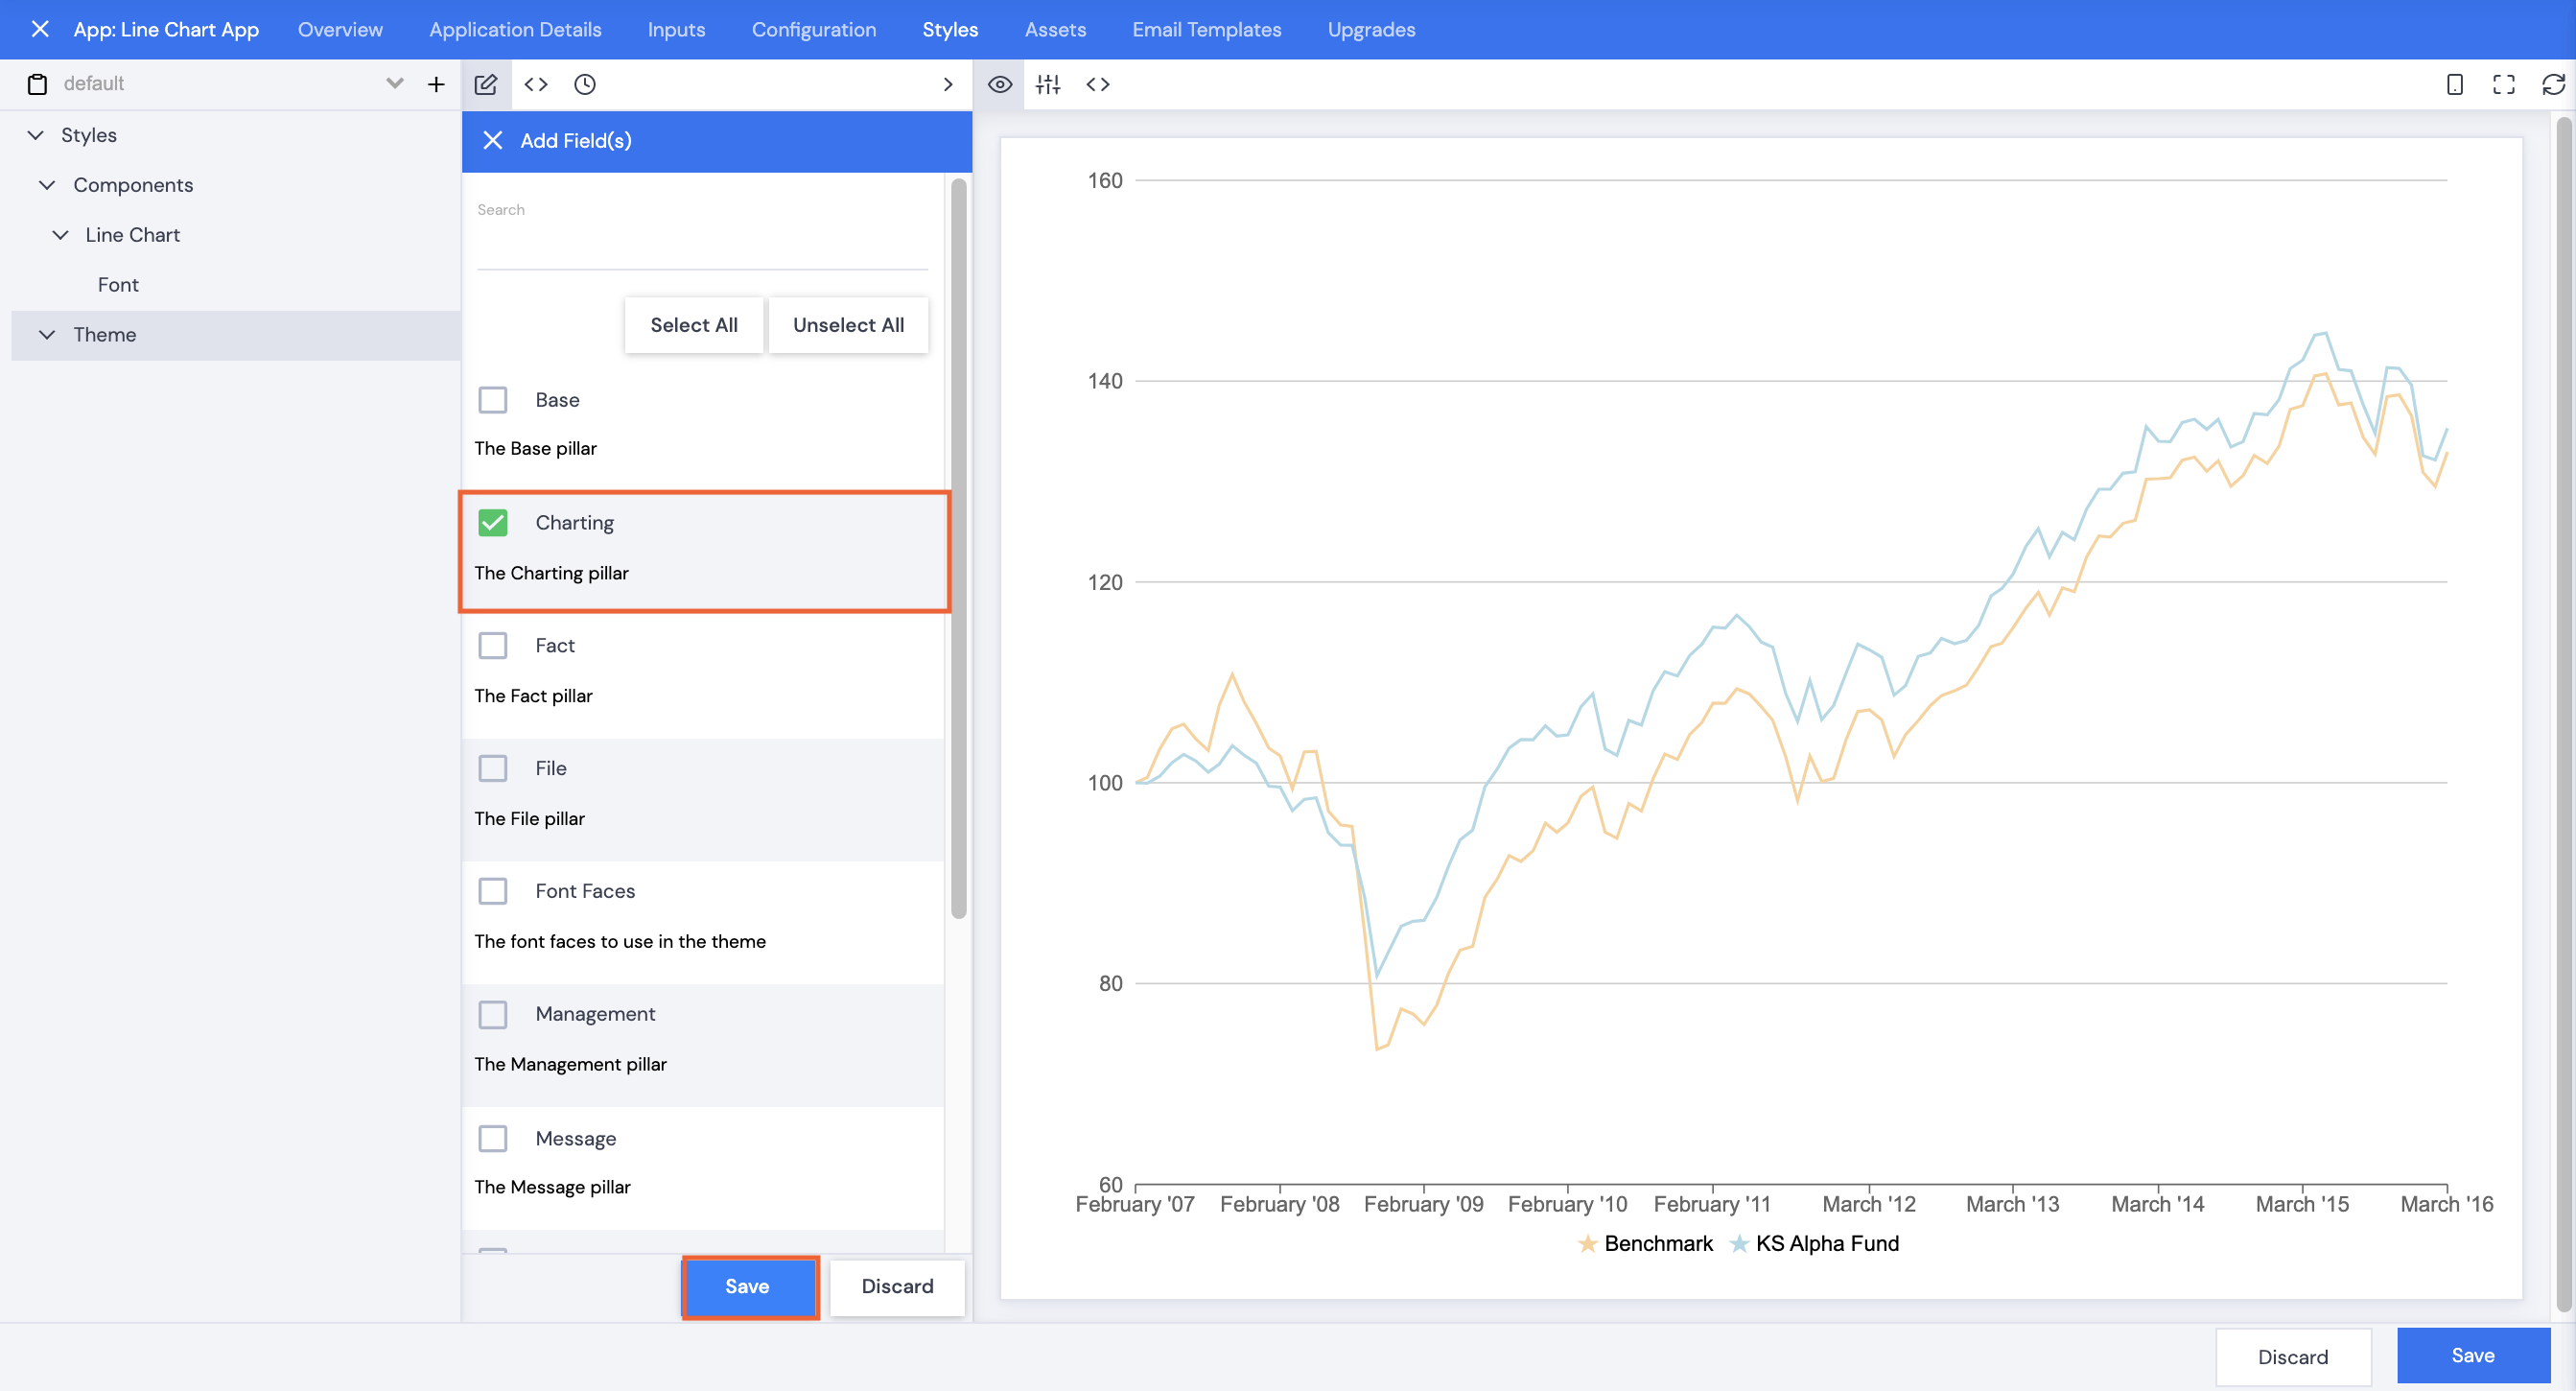
- Click Theme.
- Click Add Element+.
- Select Charting, then click Save.
- Click Charting.
- Click Add Element+.
- Scroll or search to select Line Chart, then click Save.
- Click Line Chart.
- Click Add Element+.
- Scroll or search to select Overrides, then click Save.
- Click Overrides.
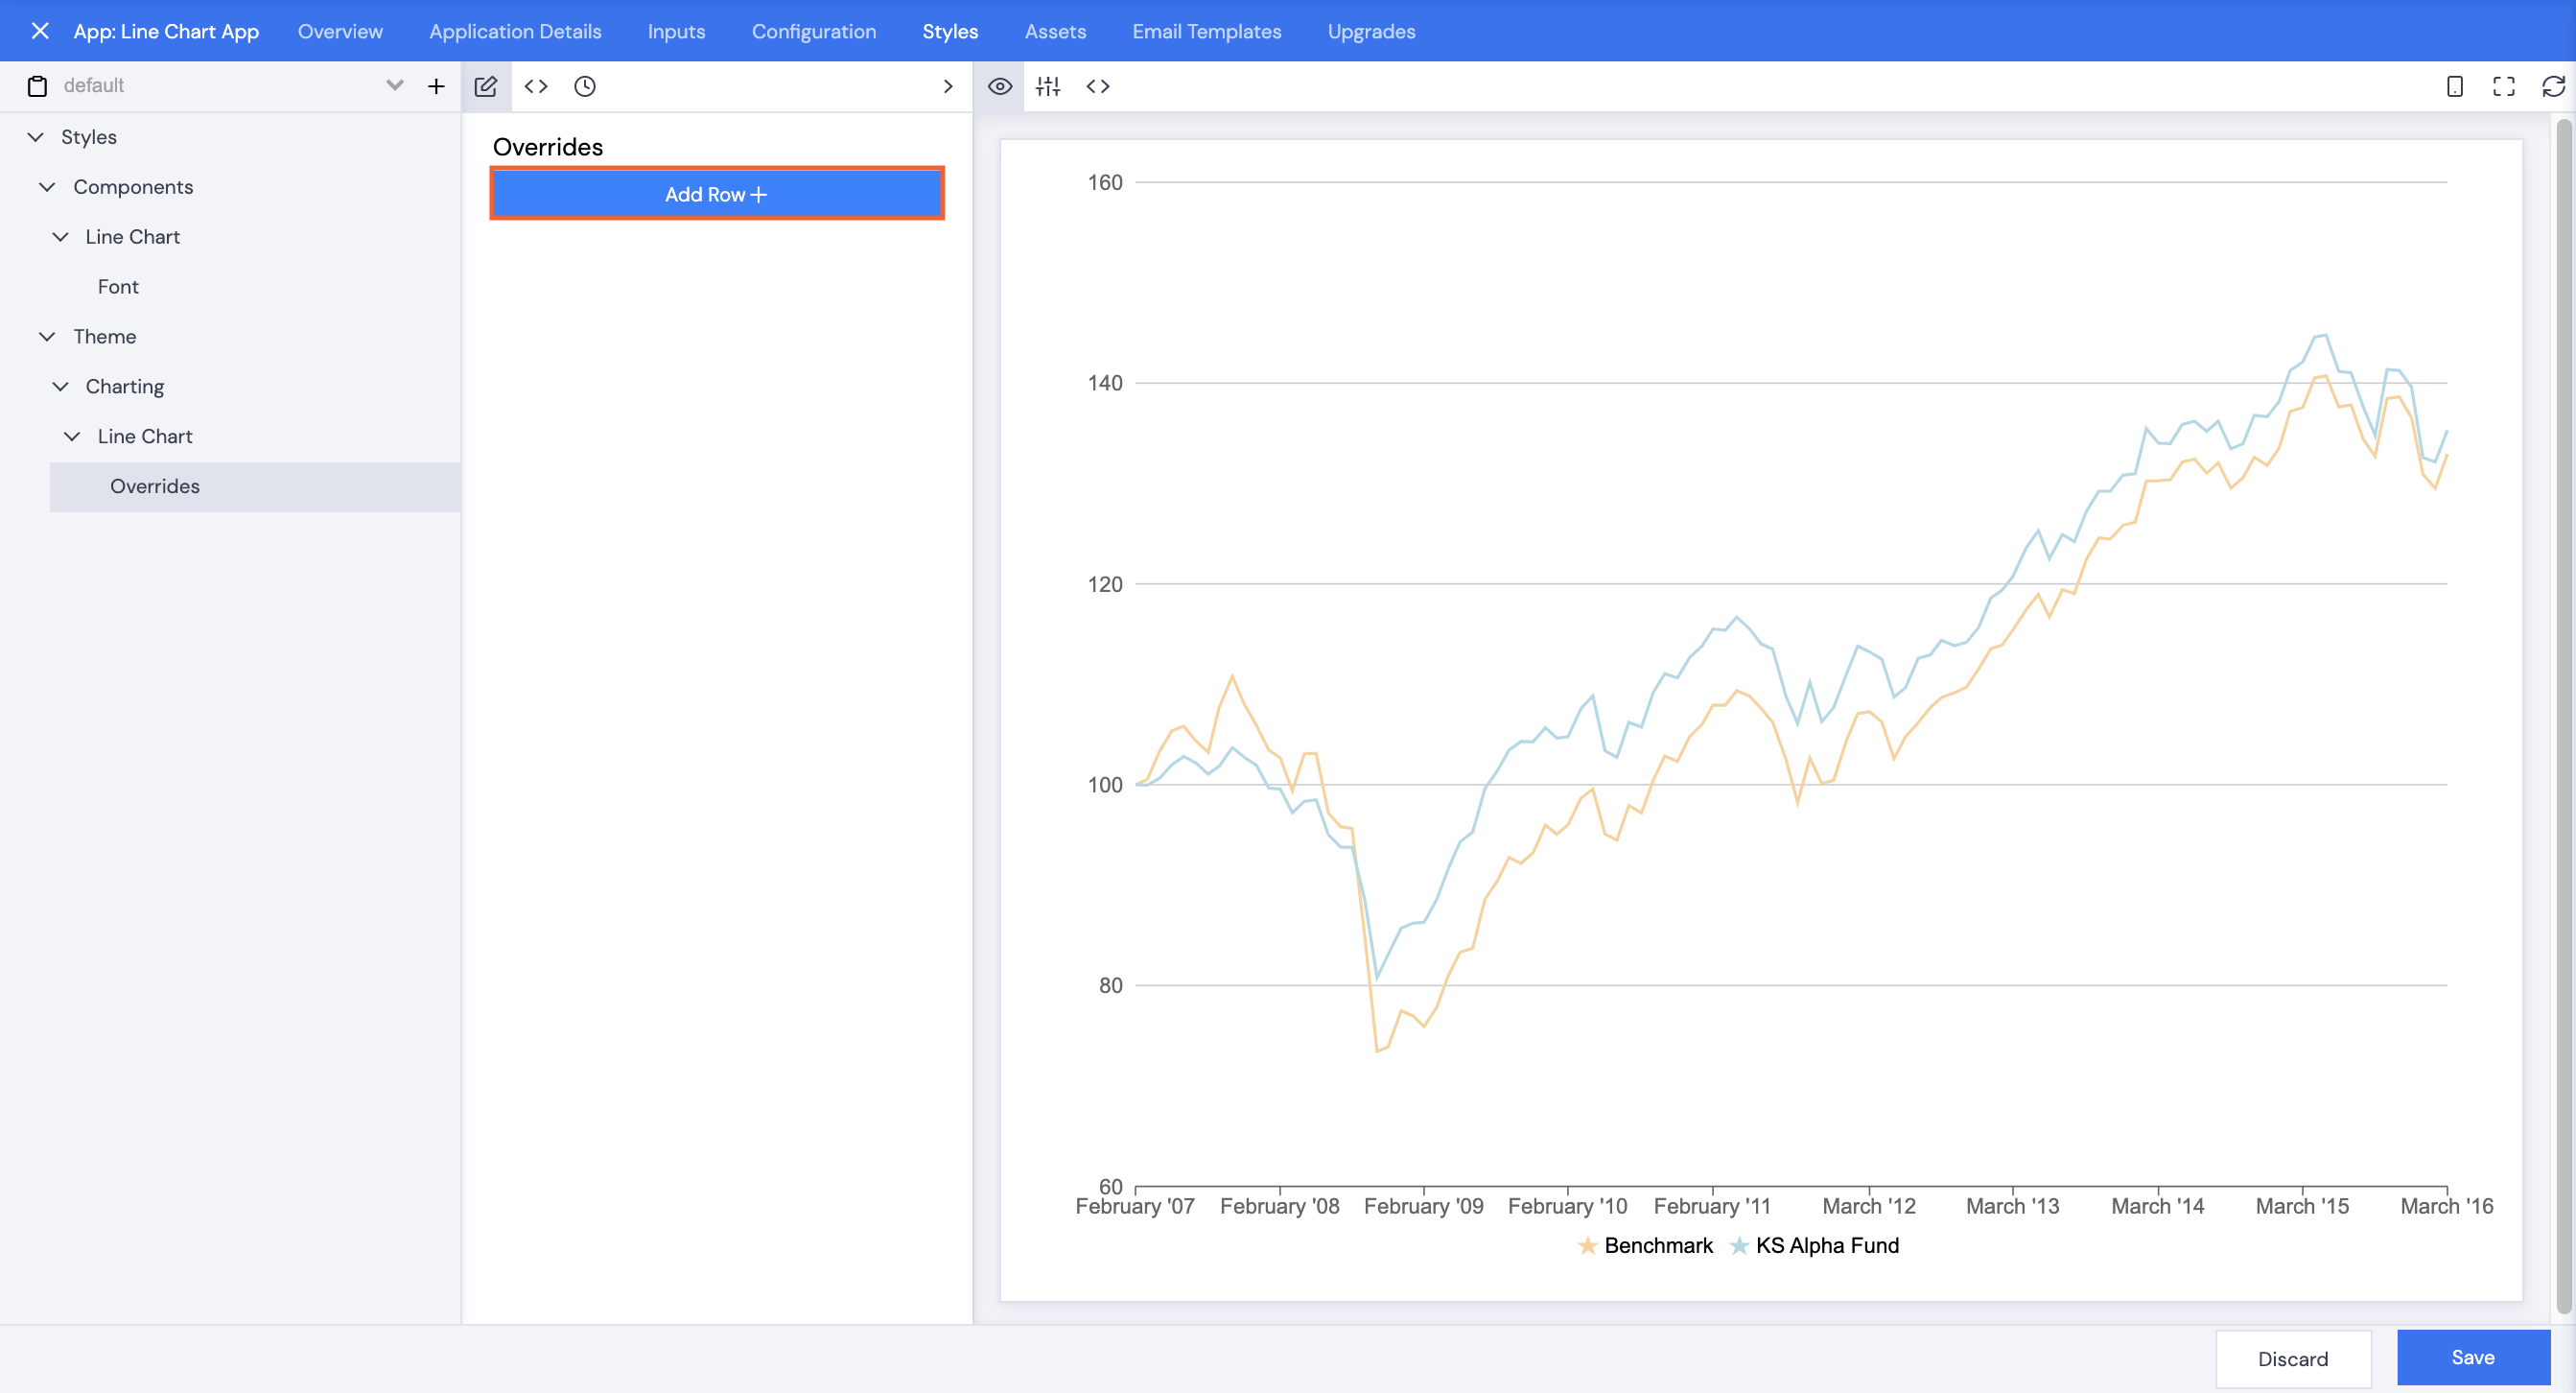
- Click Add Row+ twice.
- Click 1.No Label.
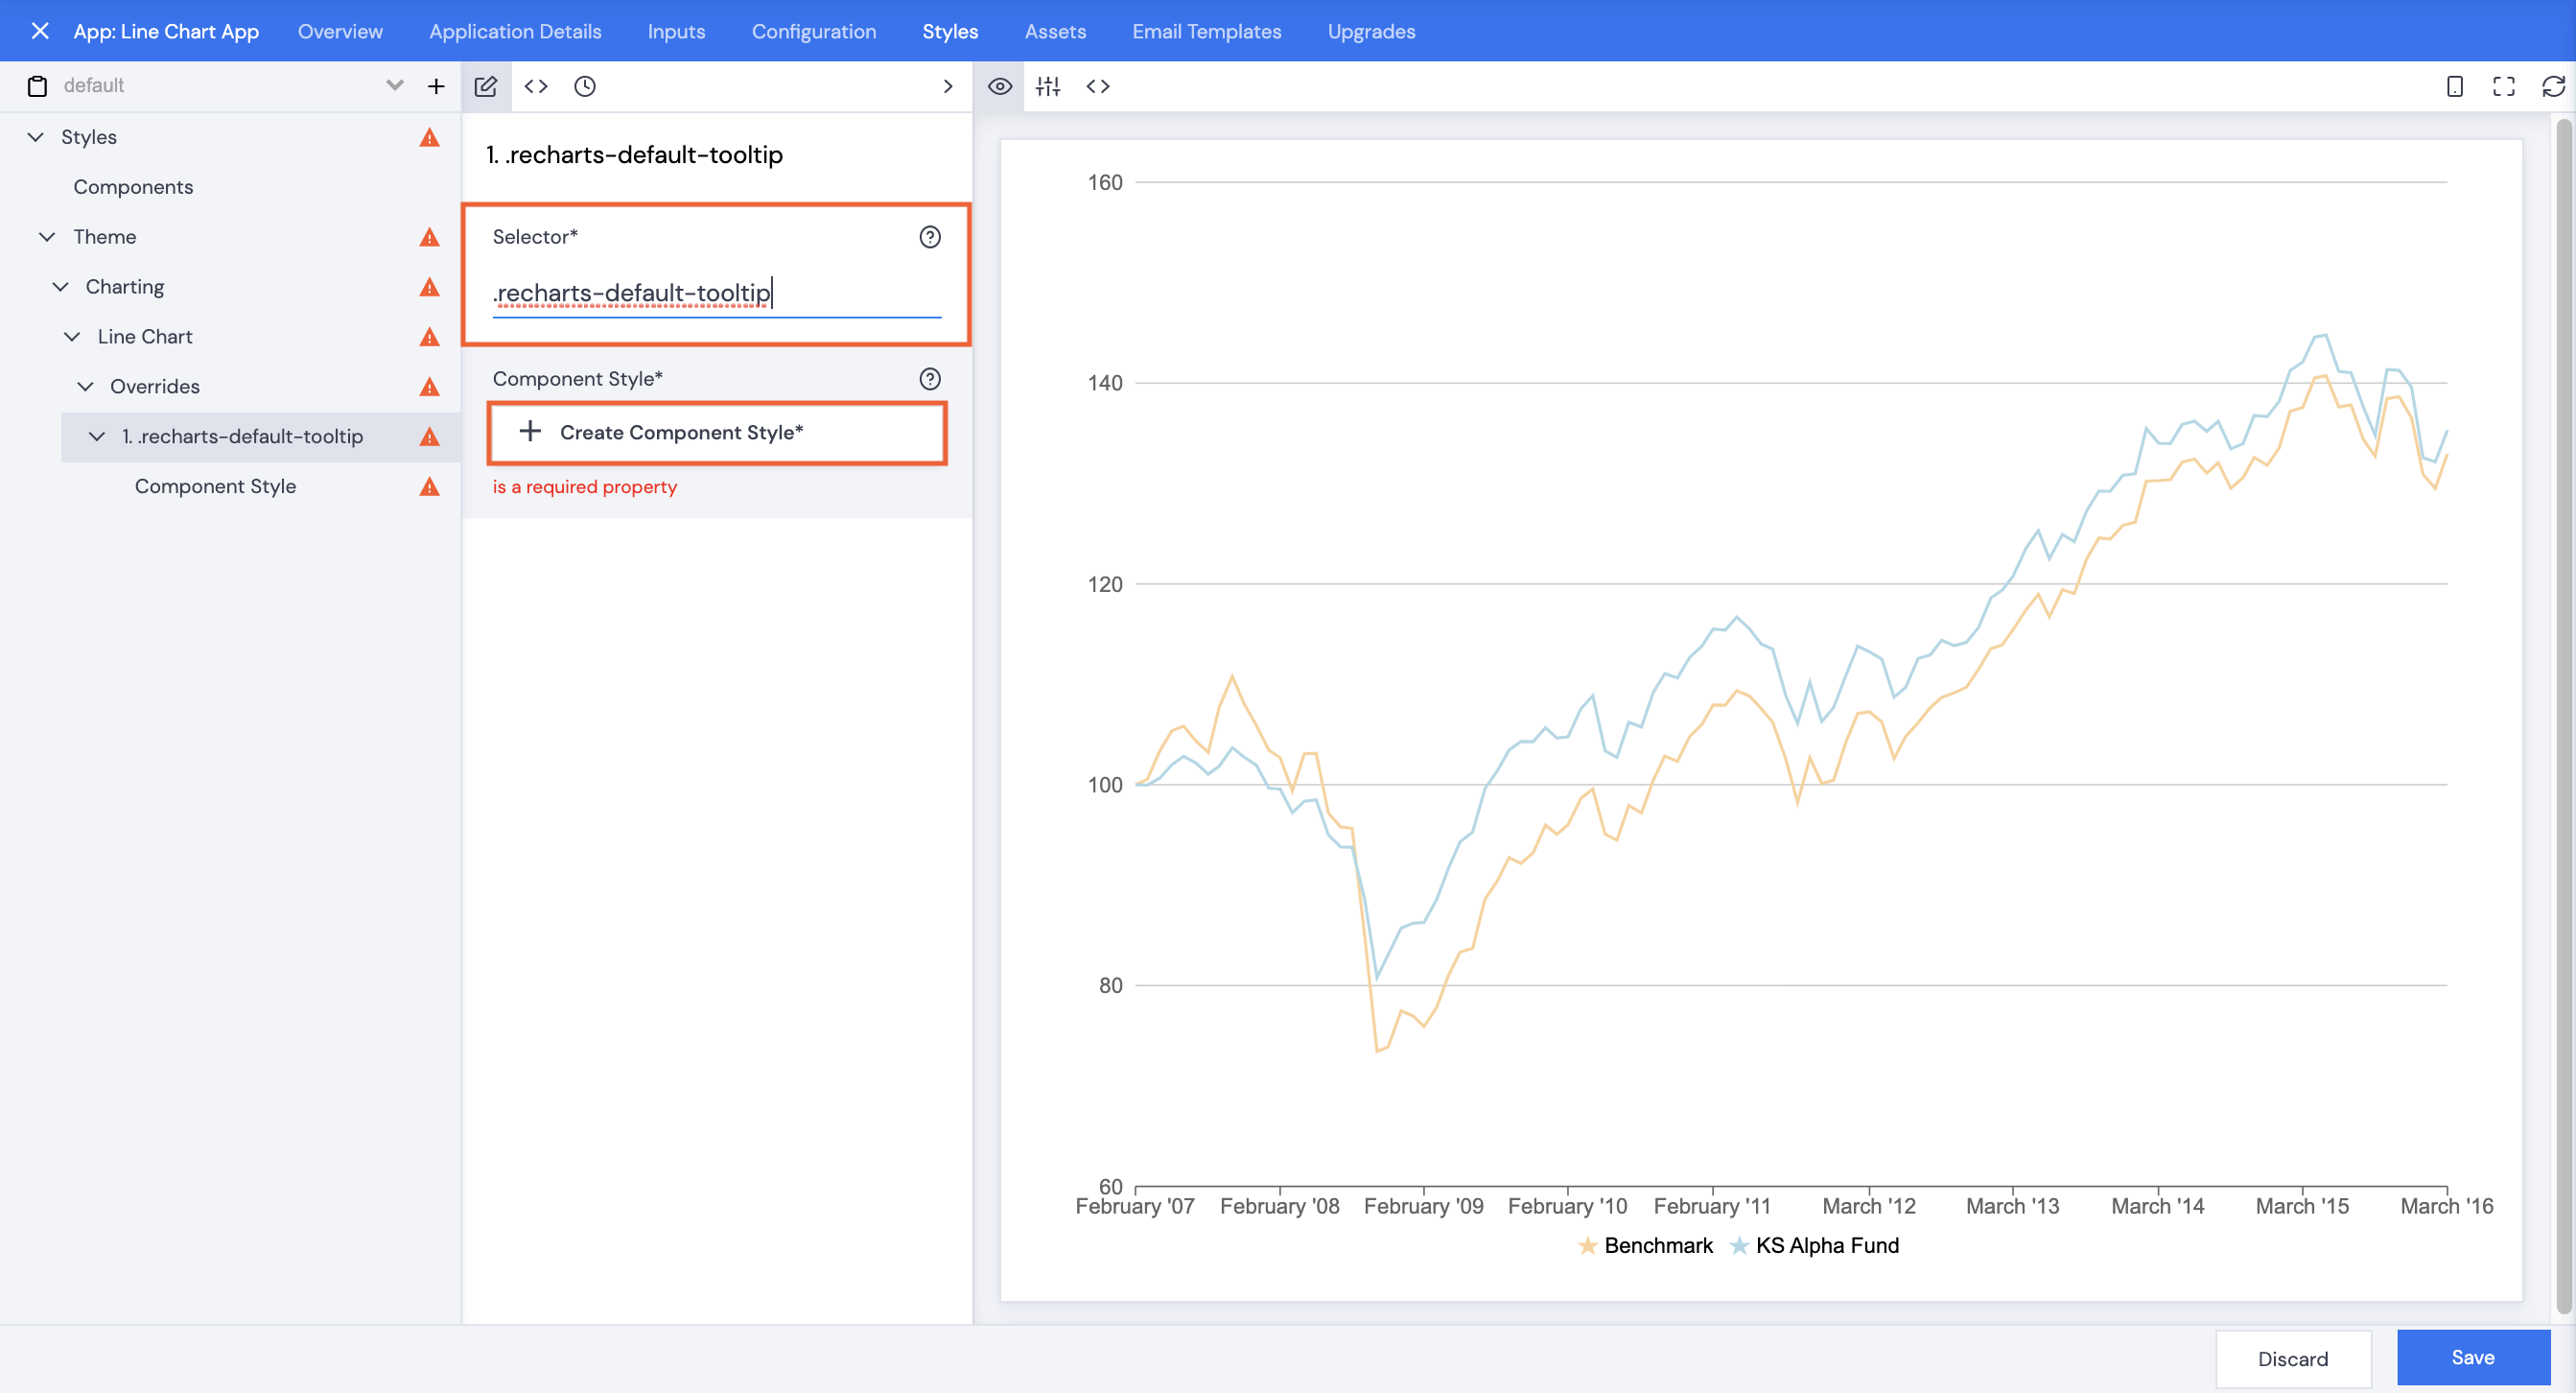
- Selector* – type in the name of the selector that is referenced in the CSS, in this case .recharts-default-tooltip (make sure you include the period in front).
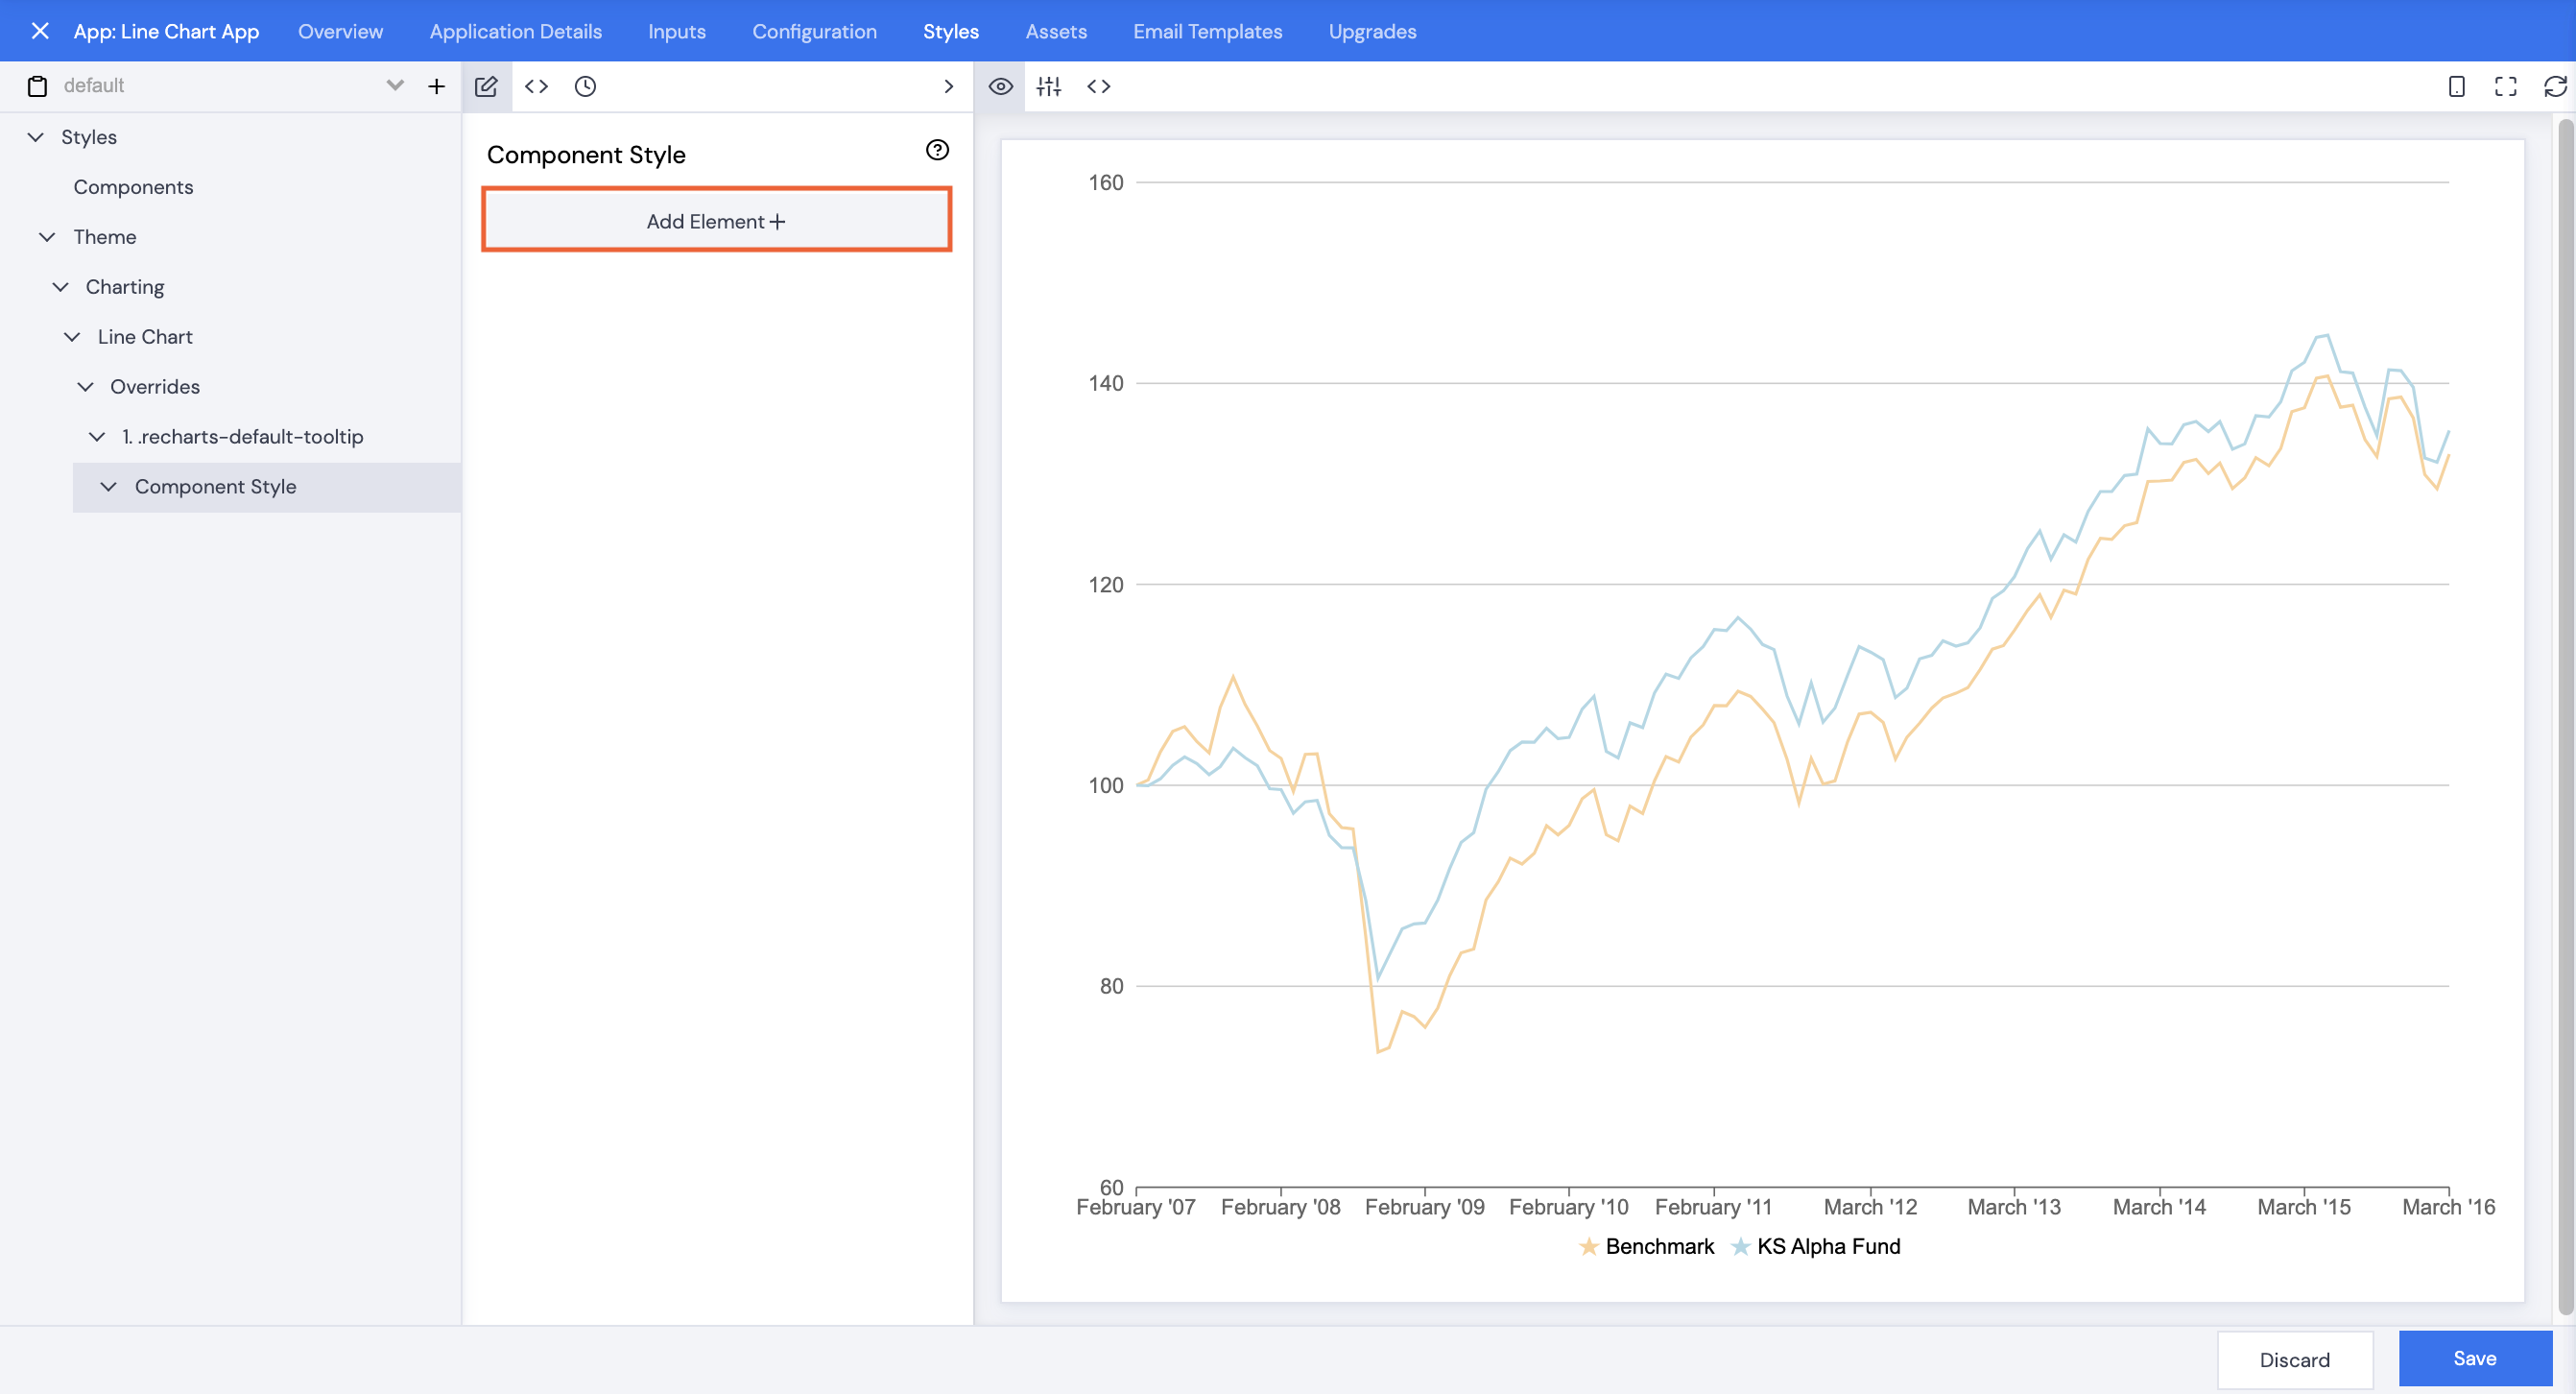
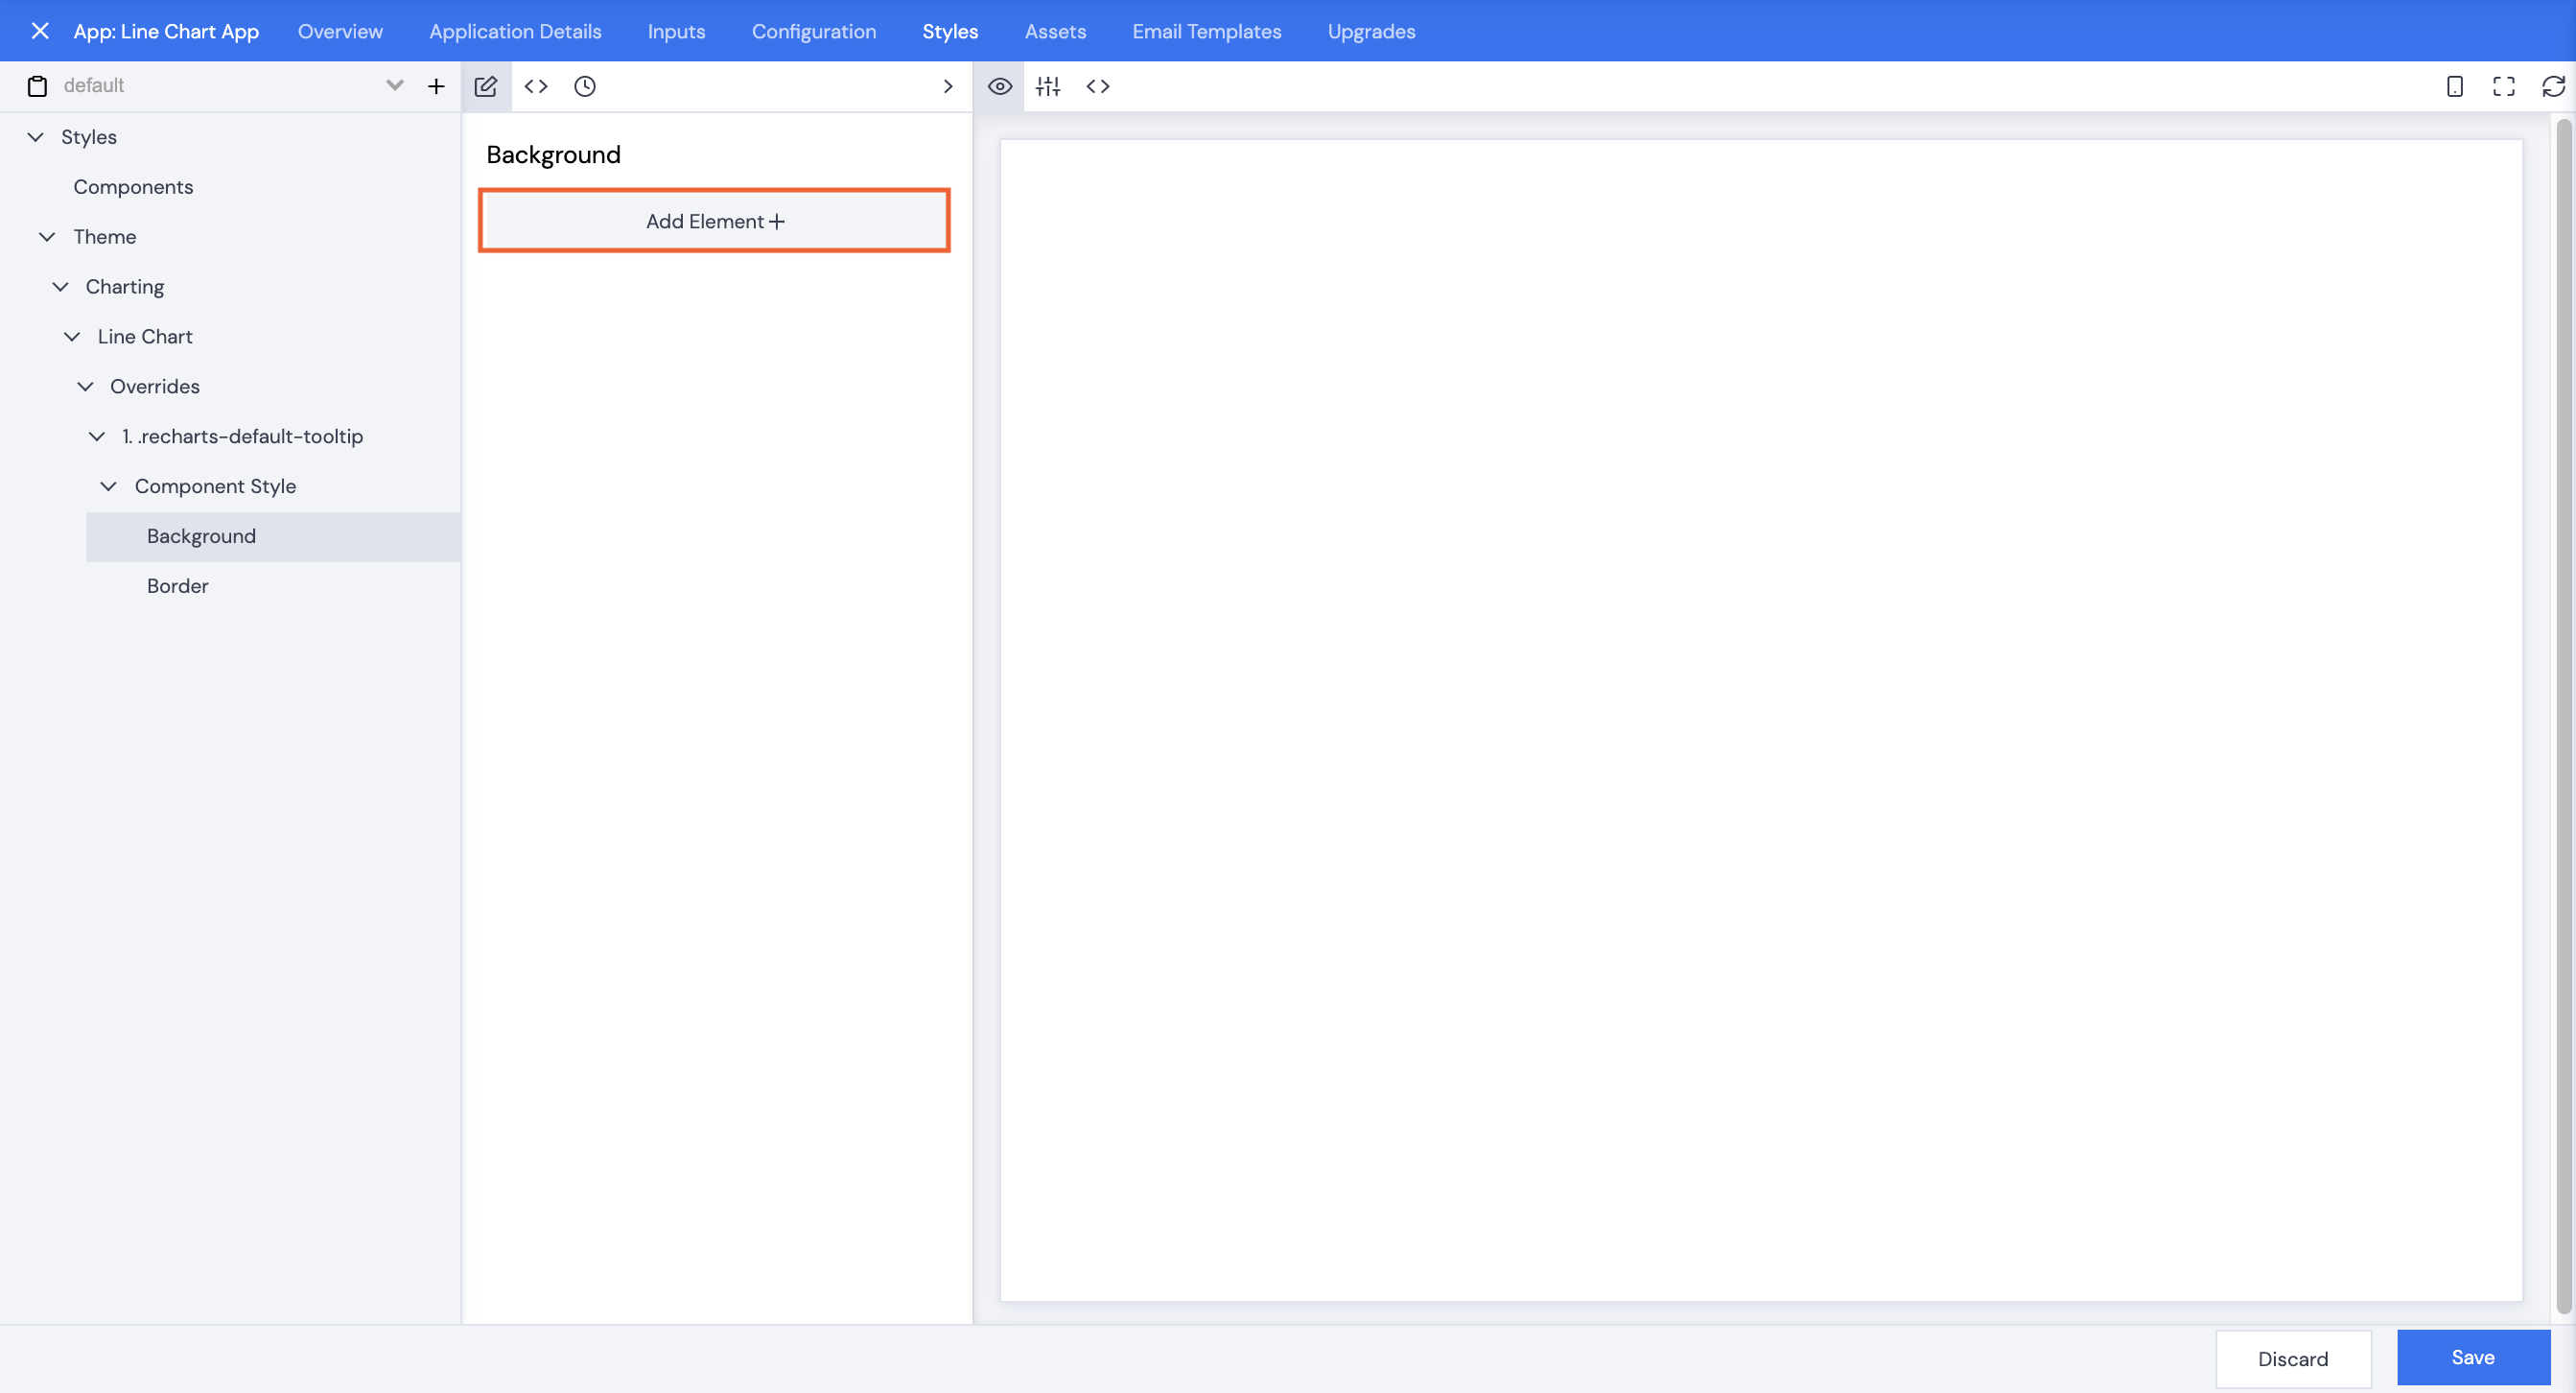
- Click +Create Component Style*.
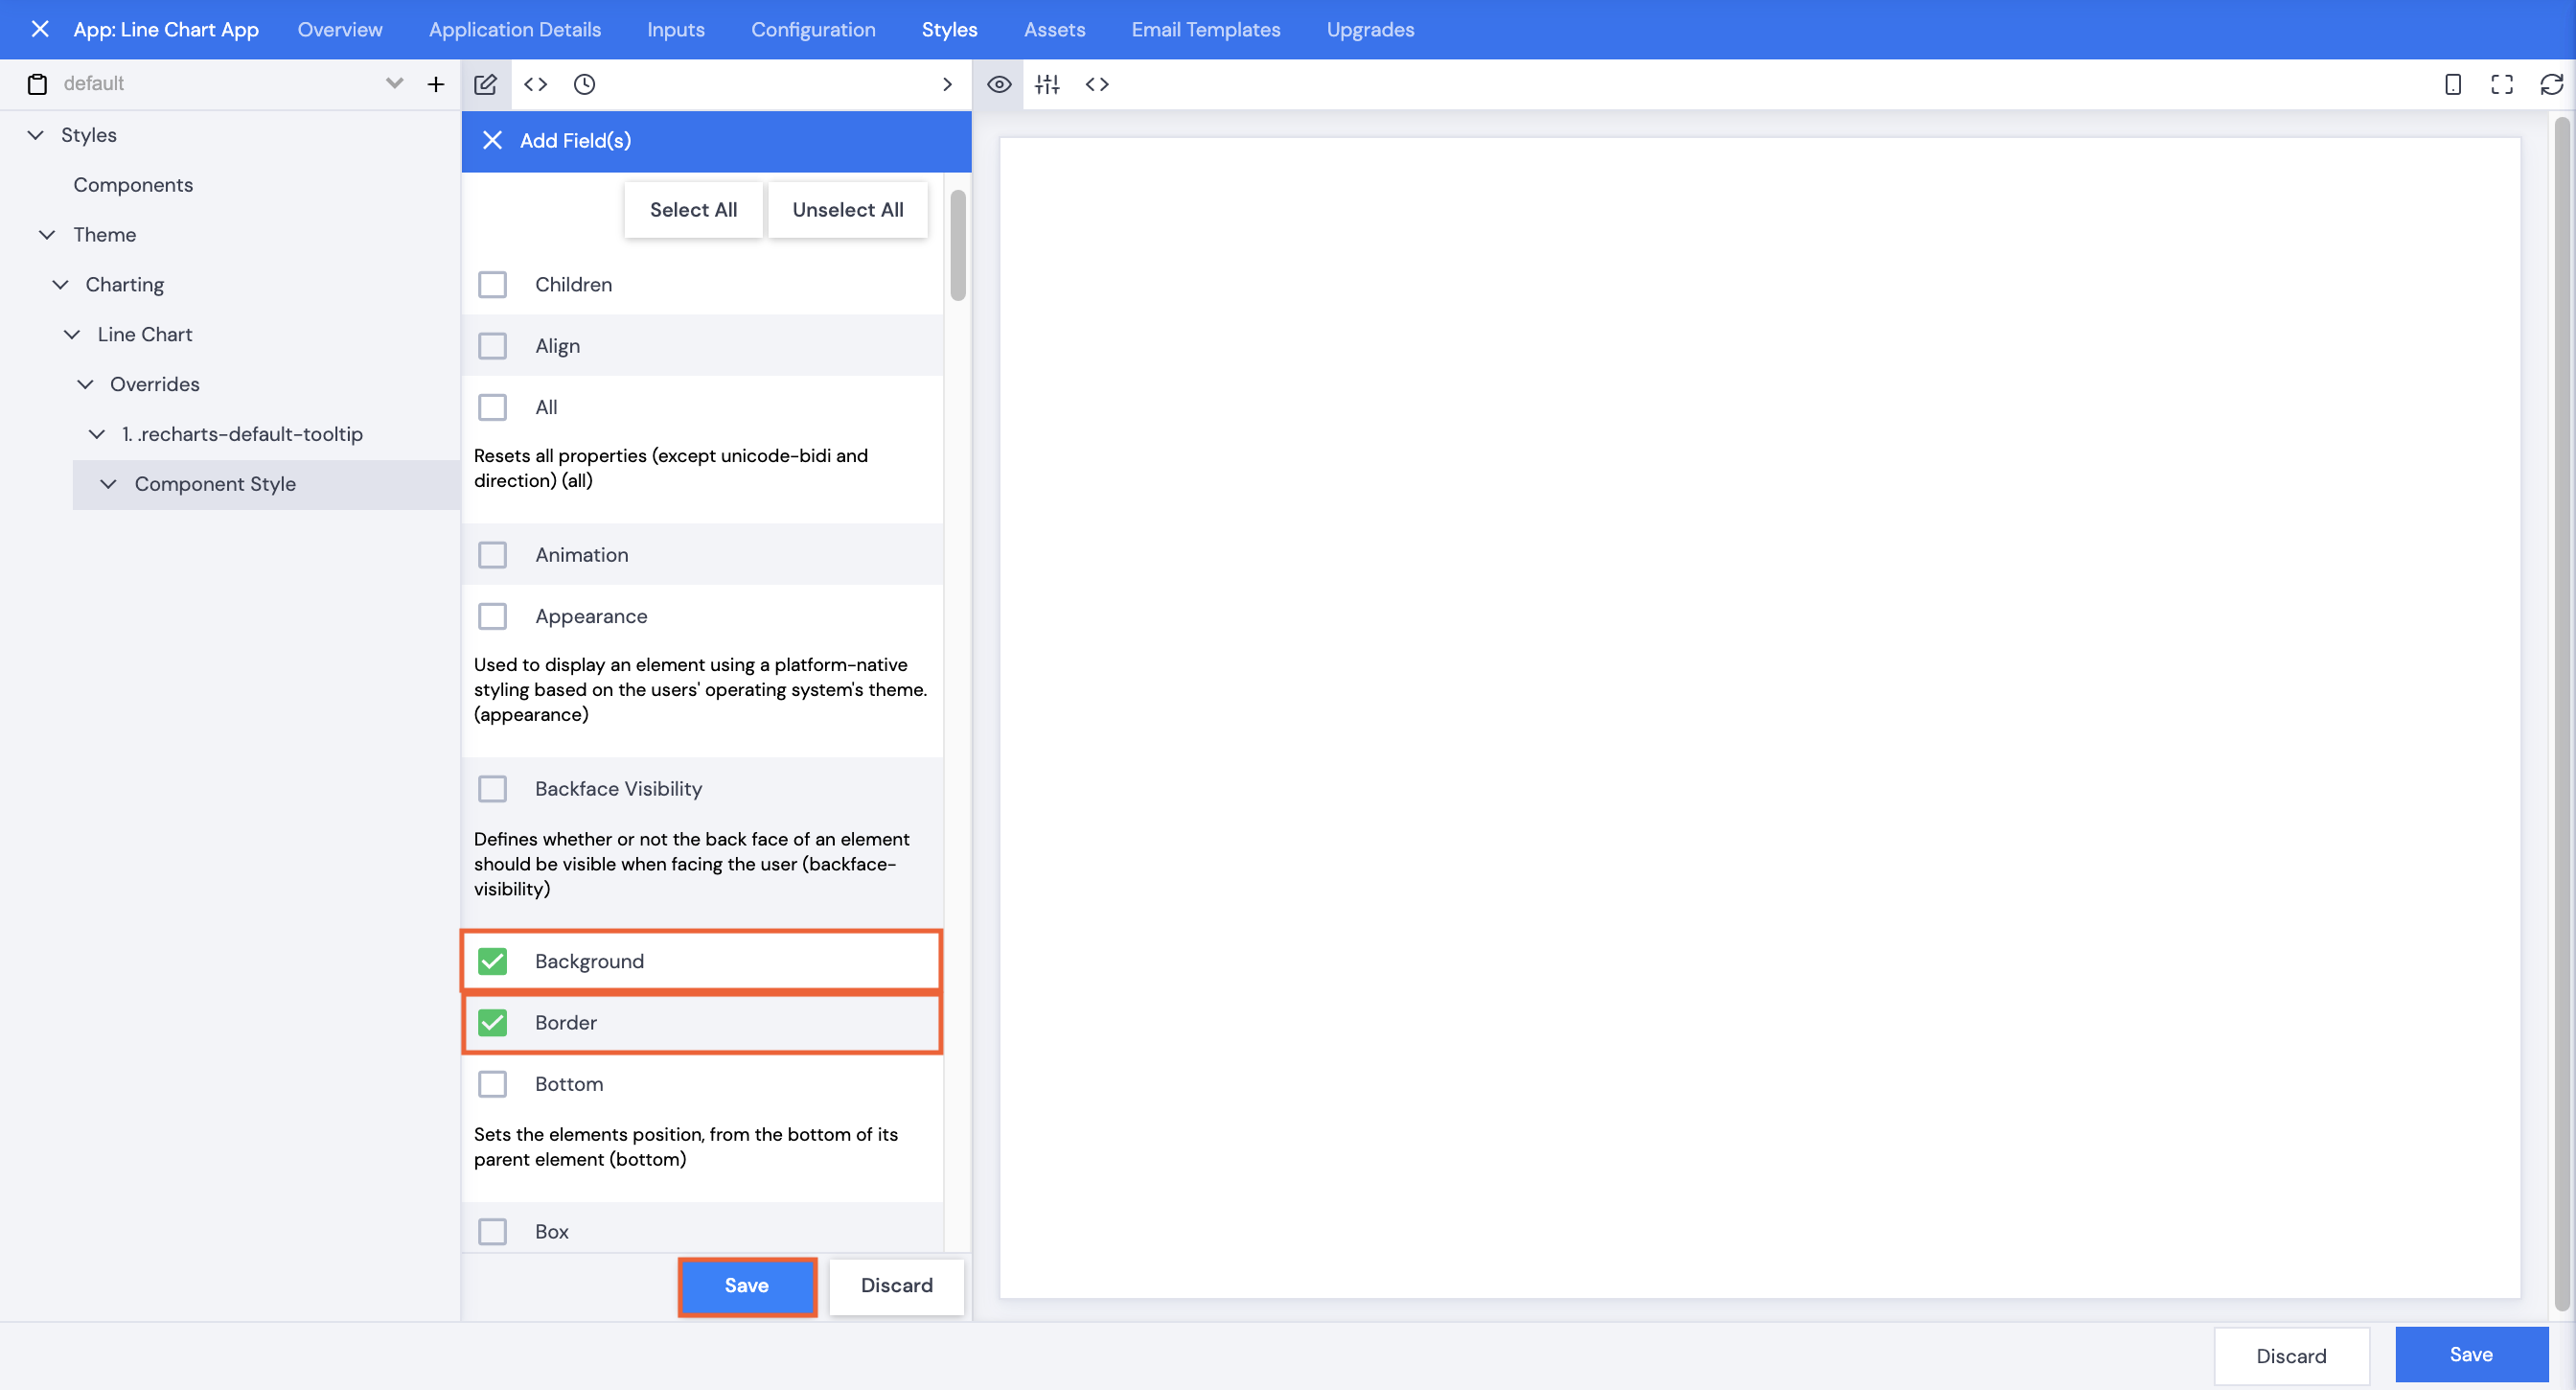
- Click Add Element+.
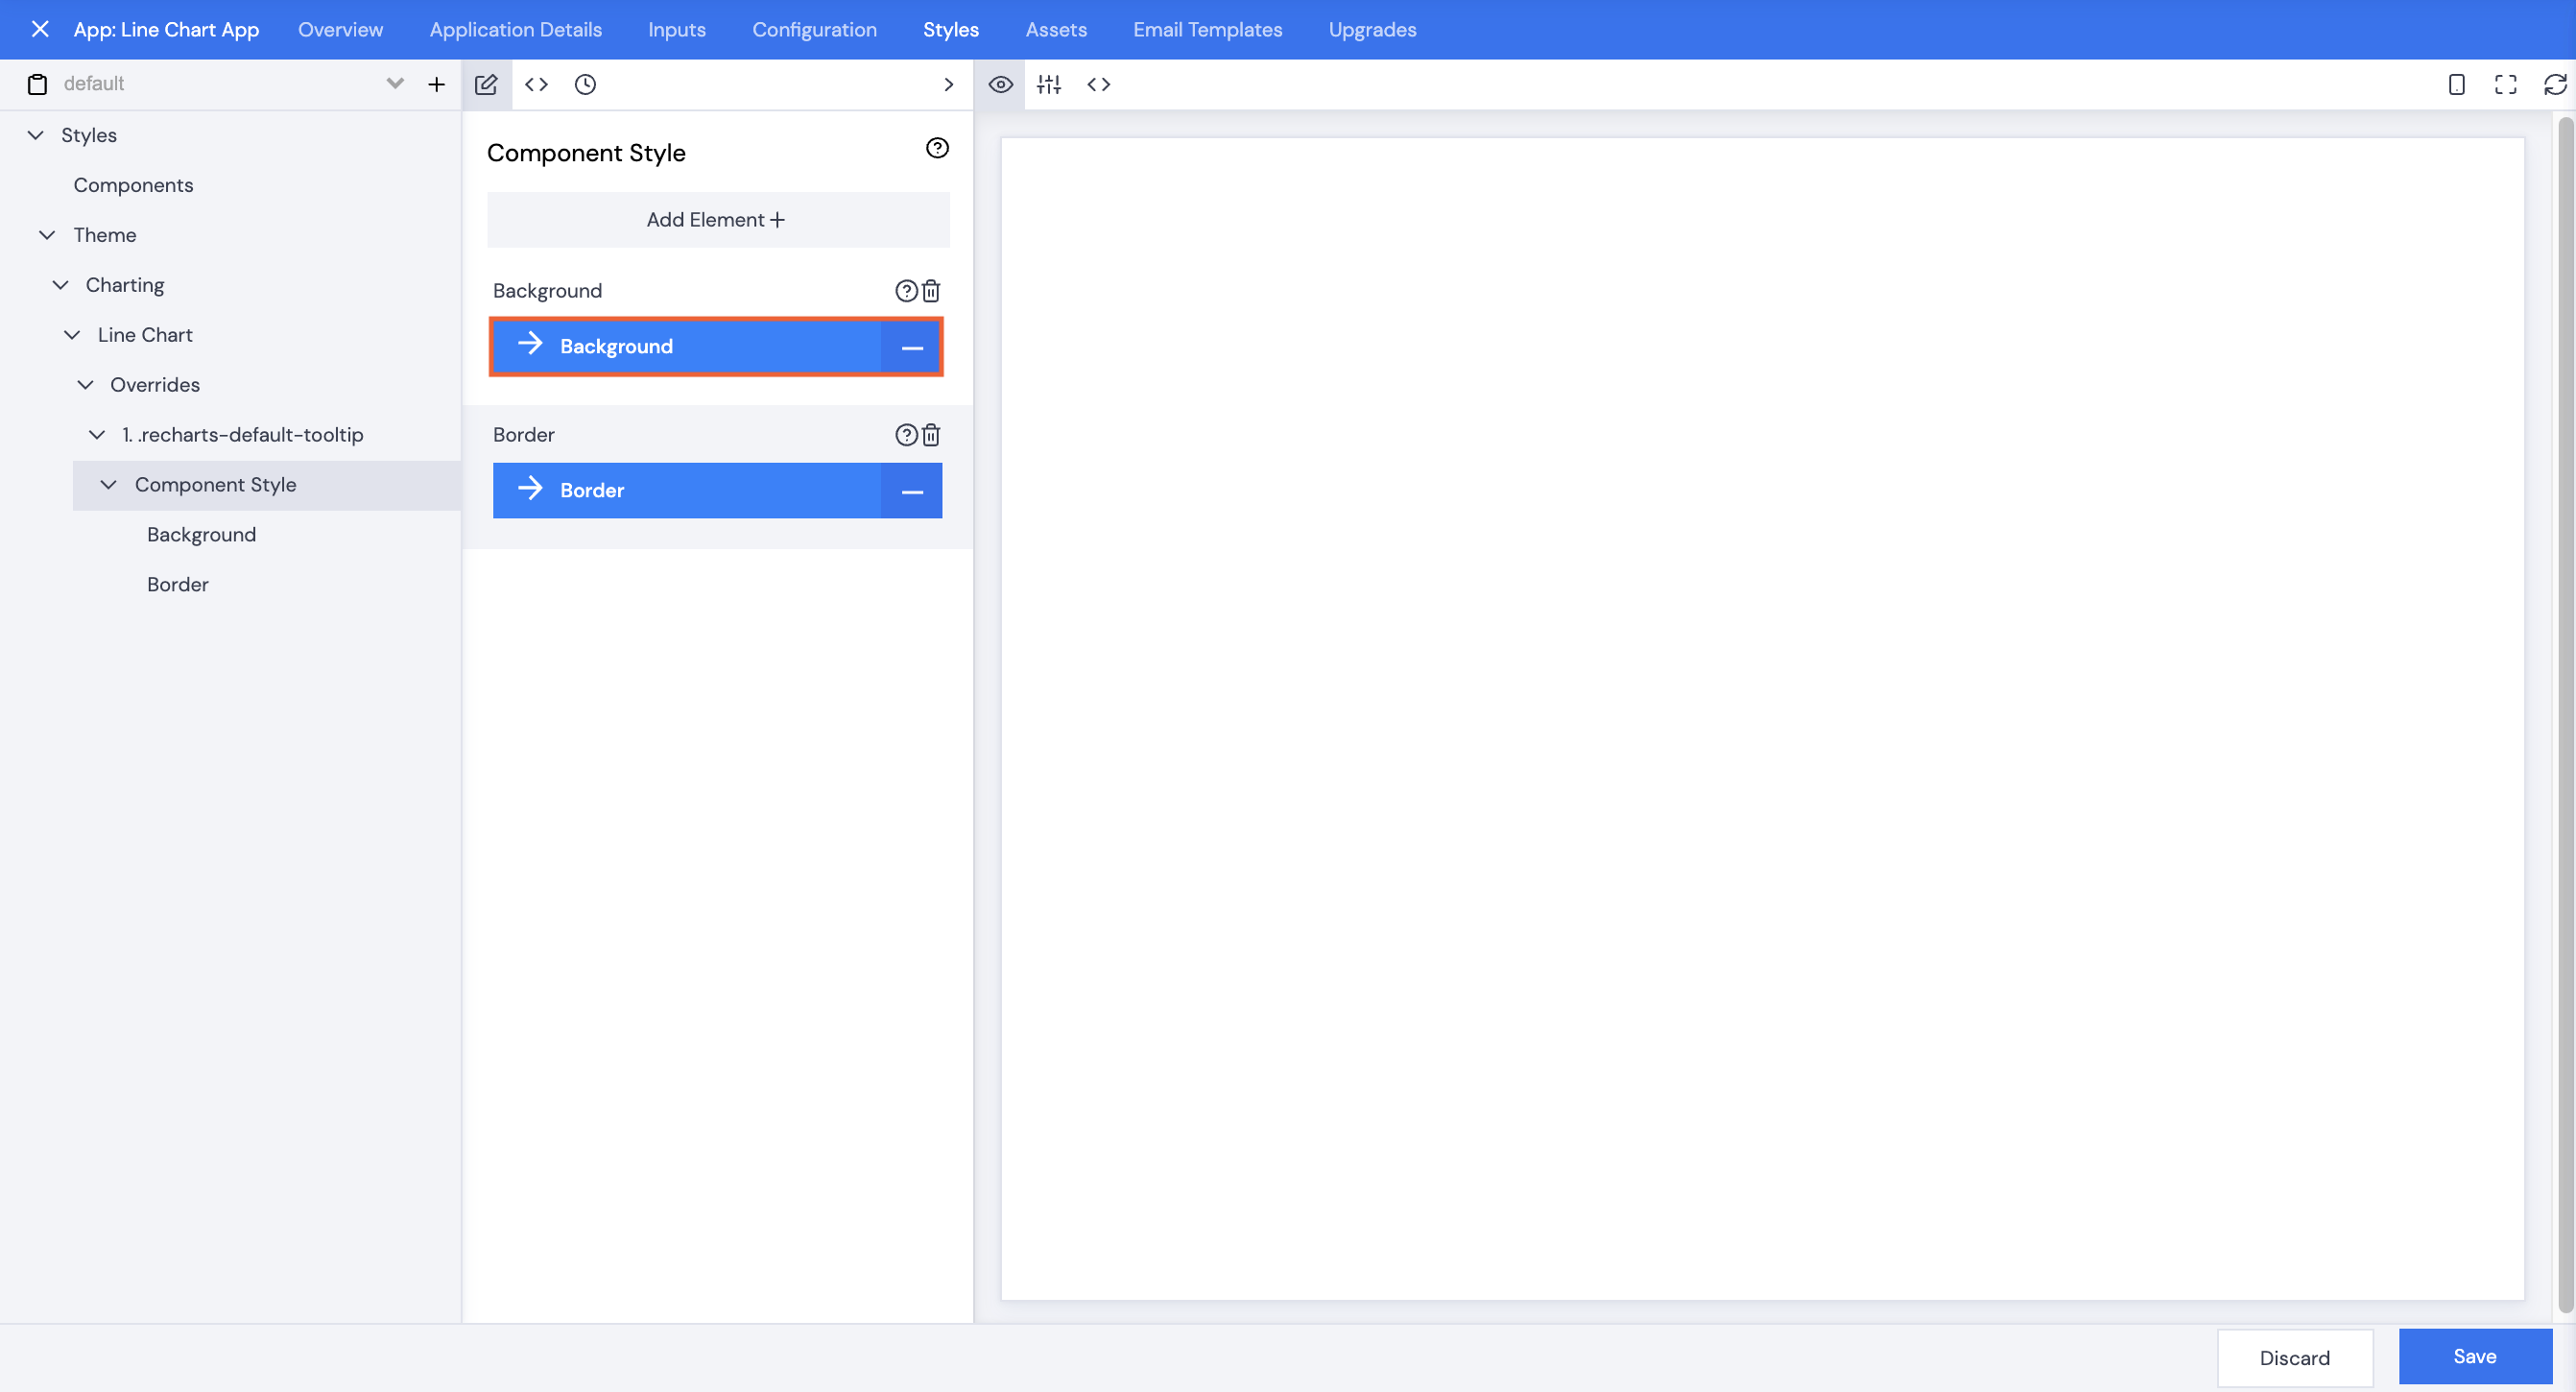
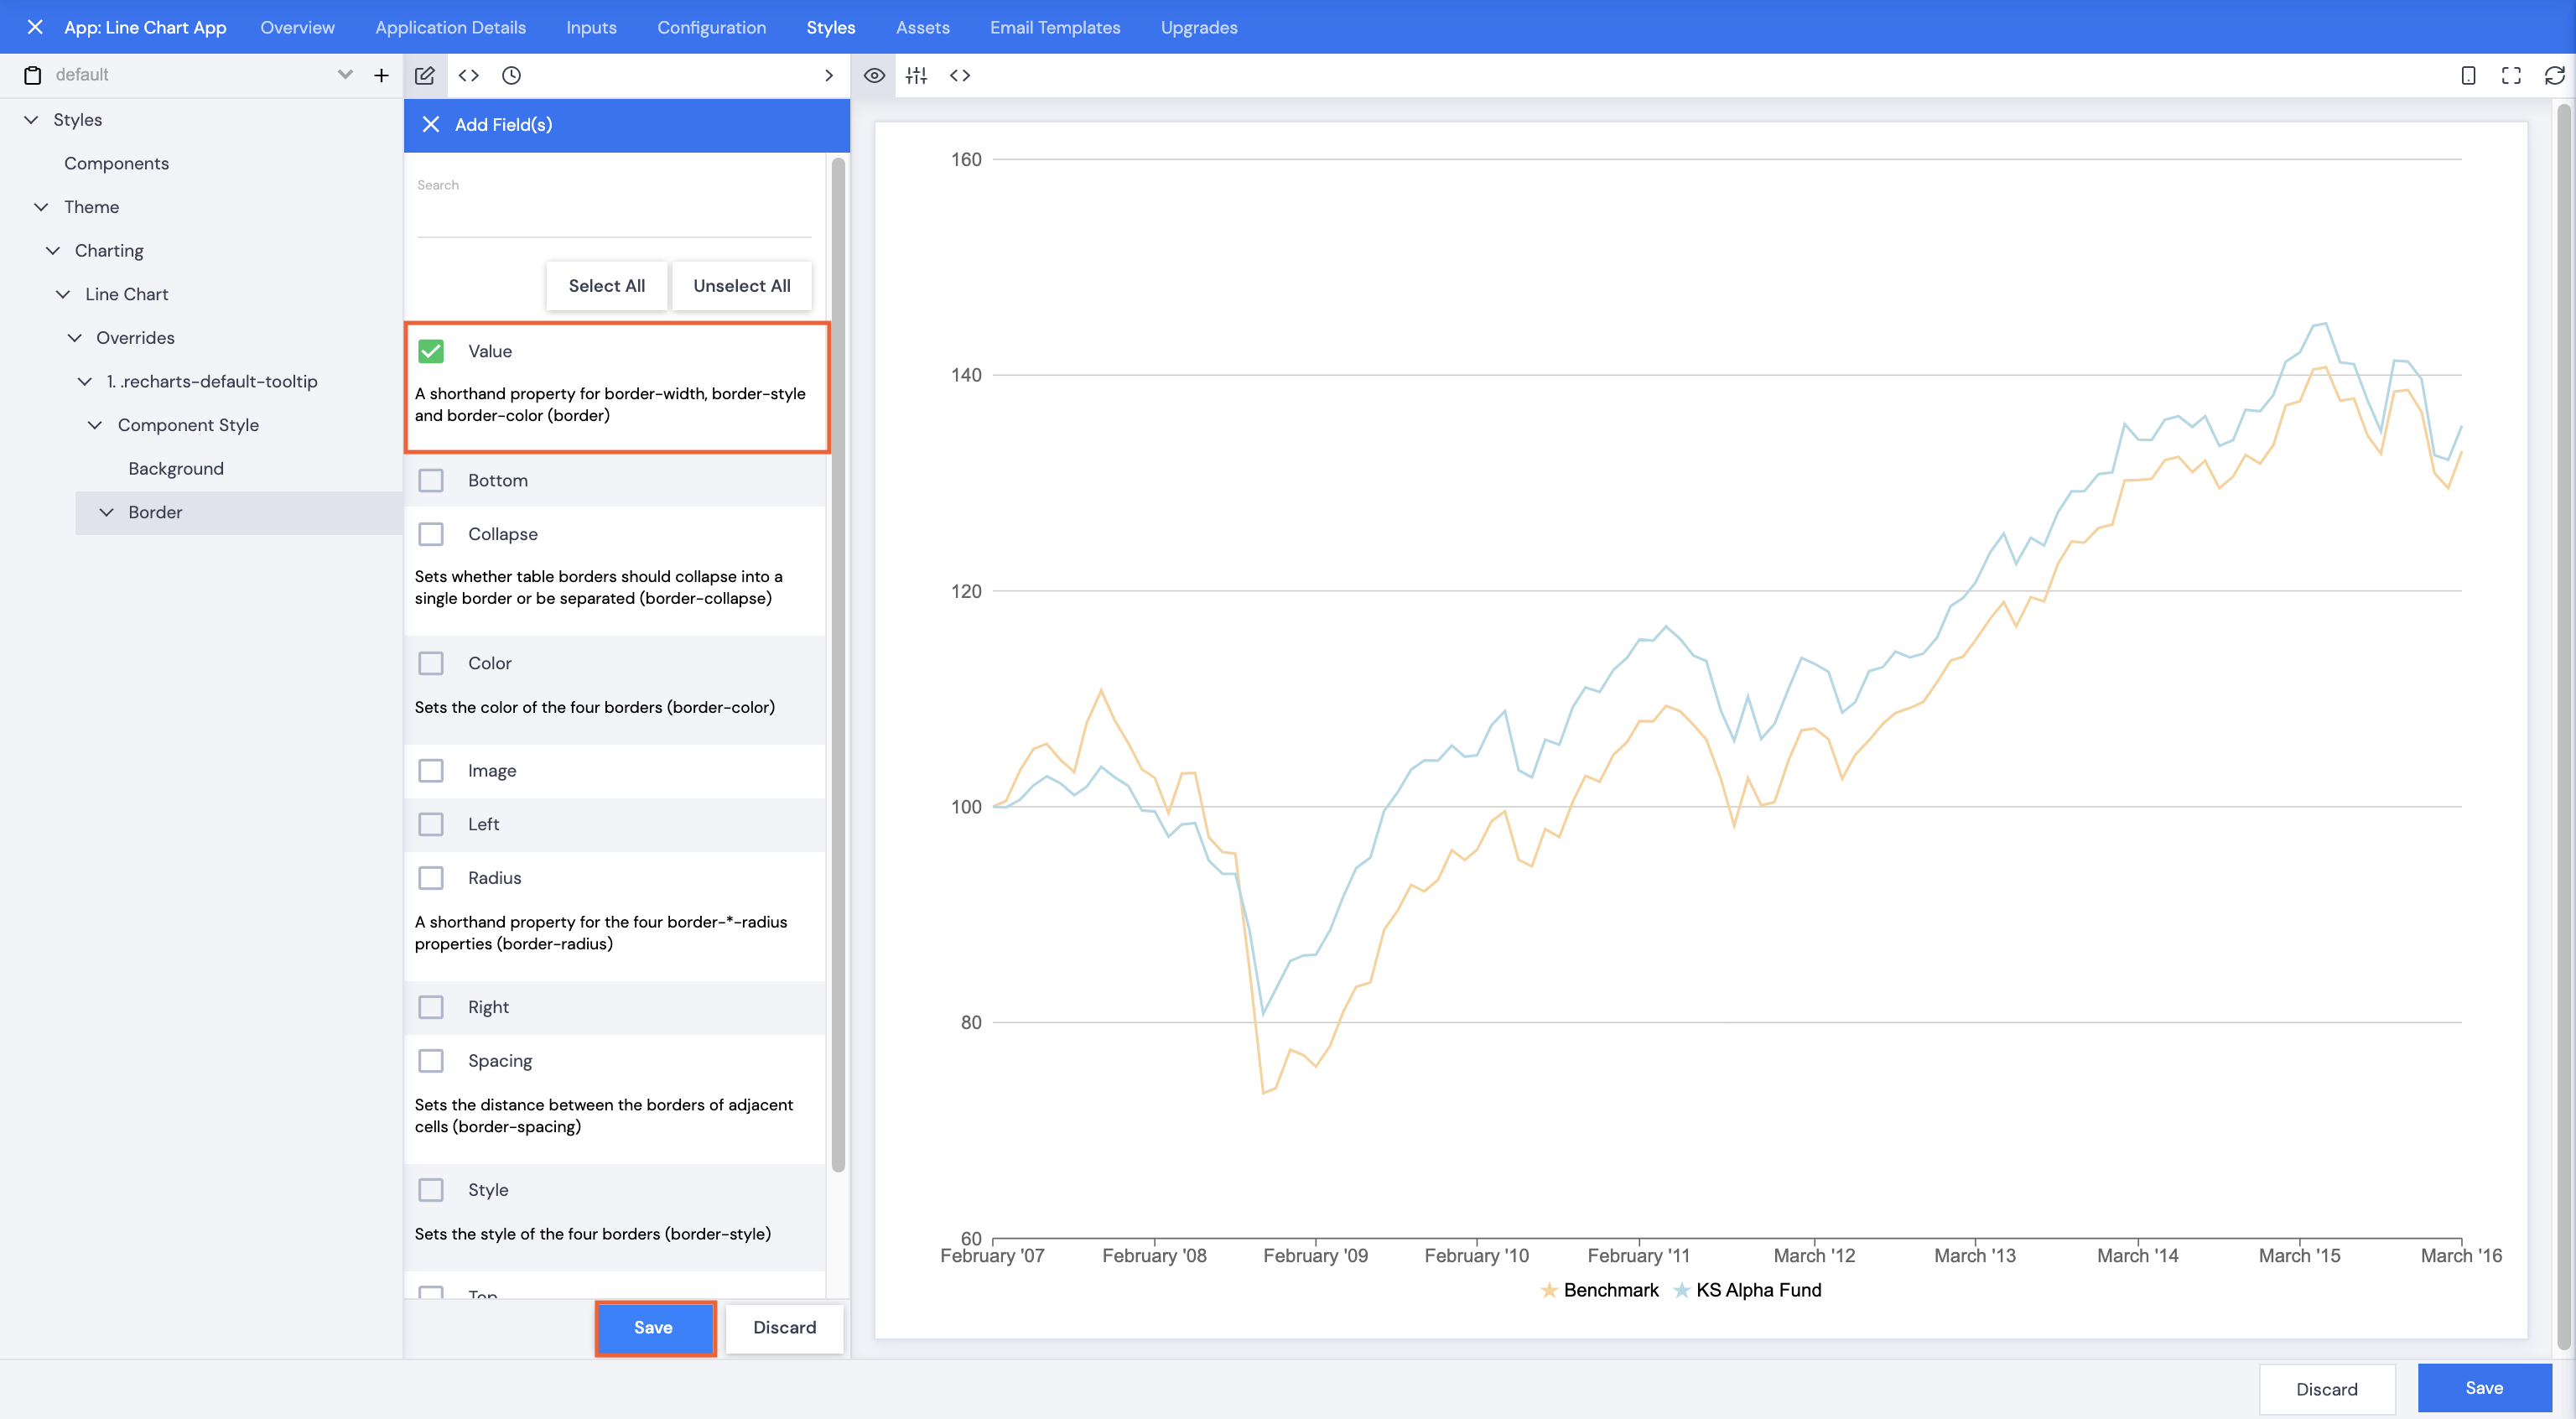
- Select Background and Border, then click Save.
- Click Background.
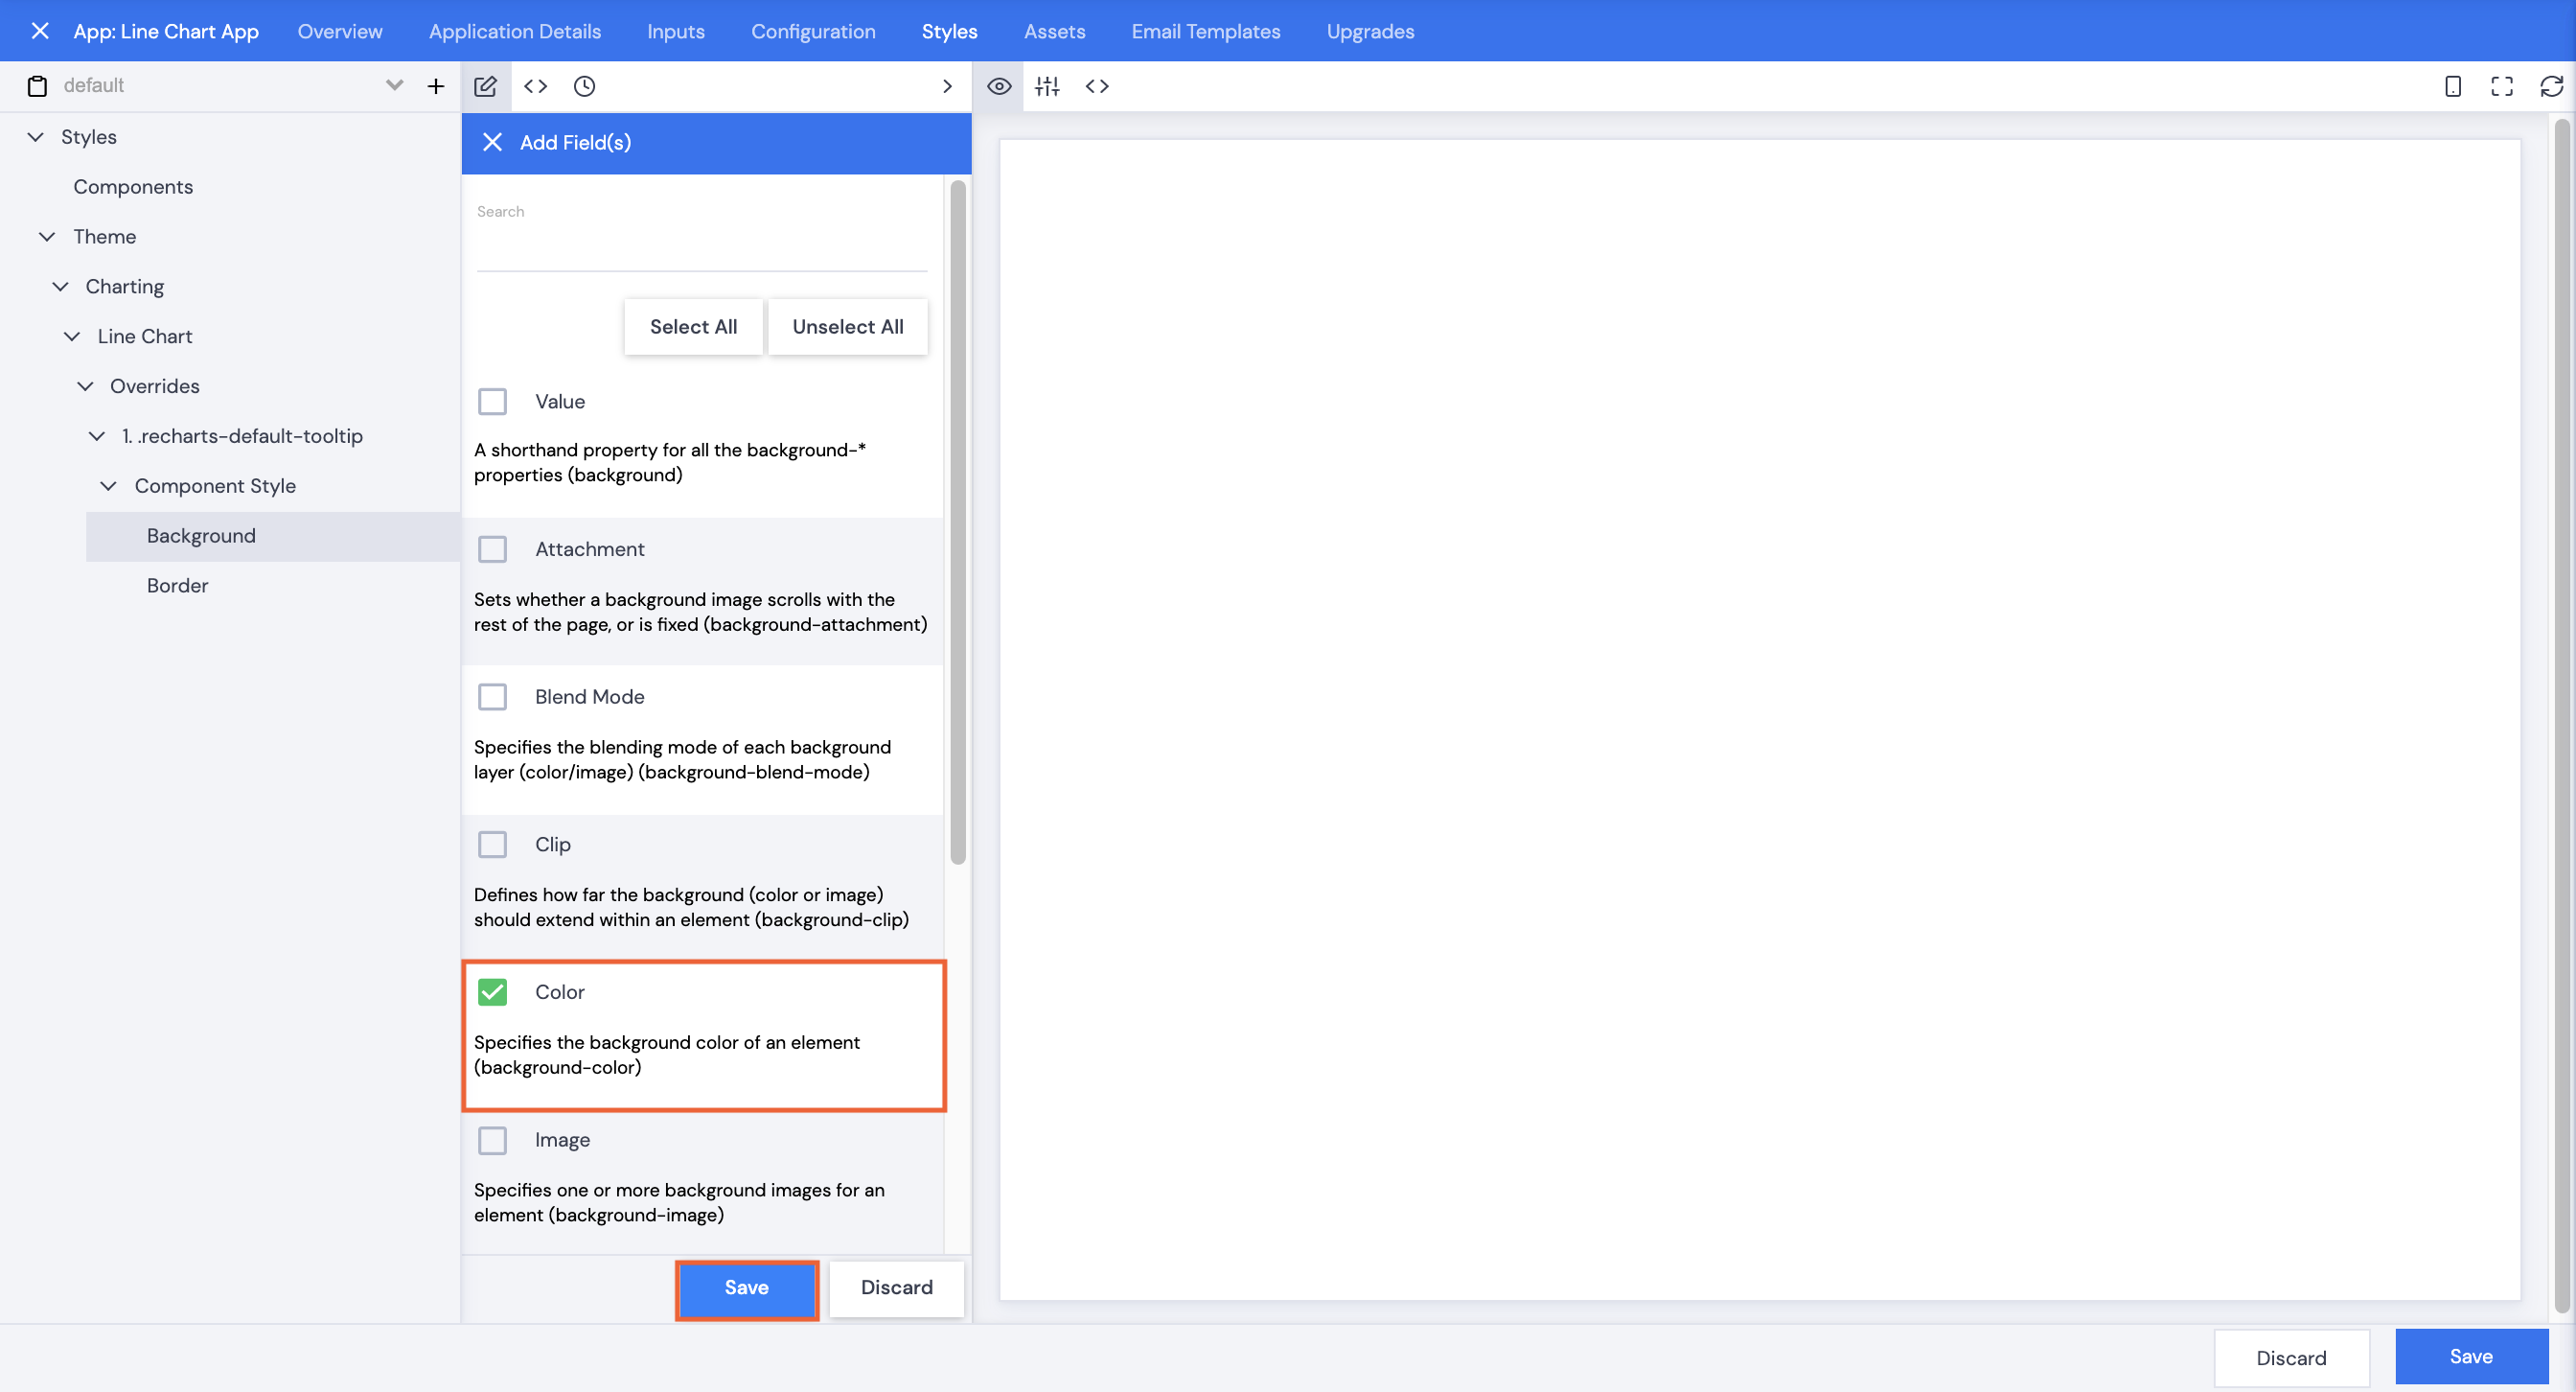
- Click Add Element+.
- Scroll or search to select Color.
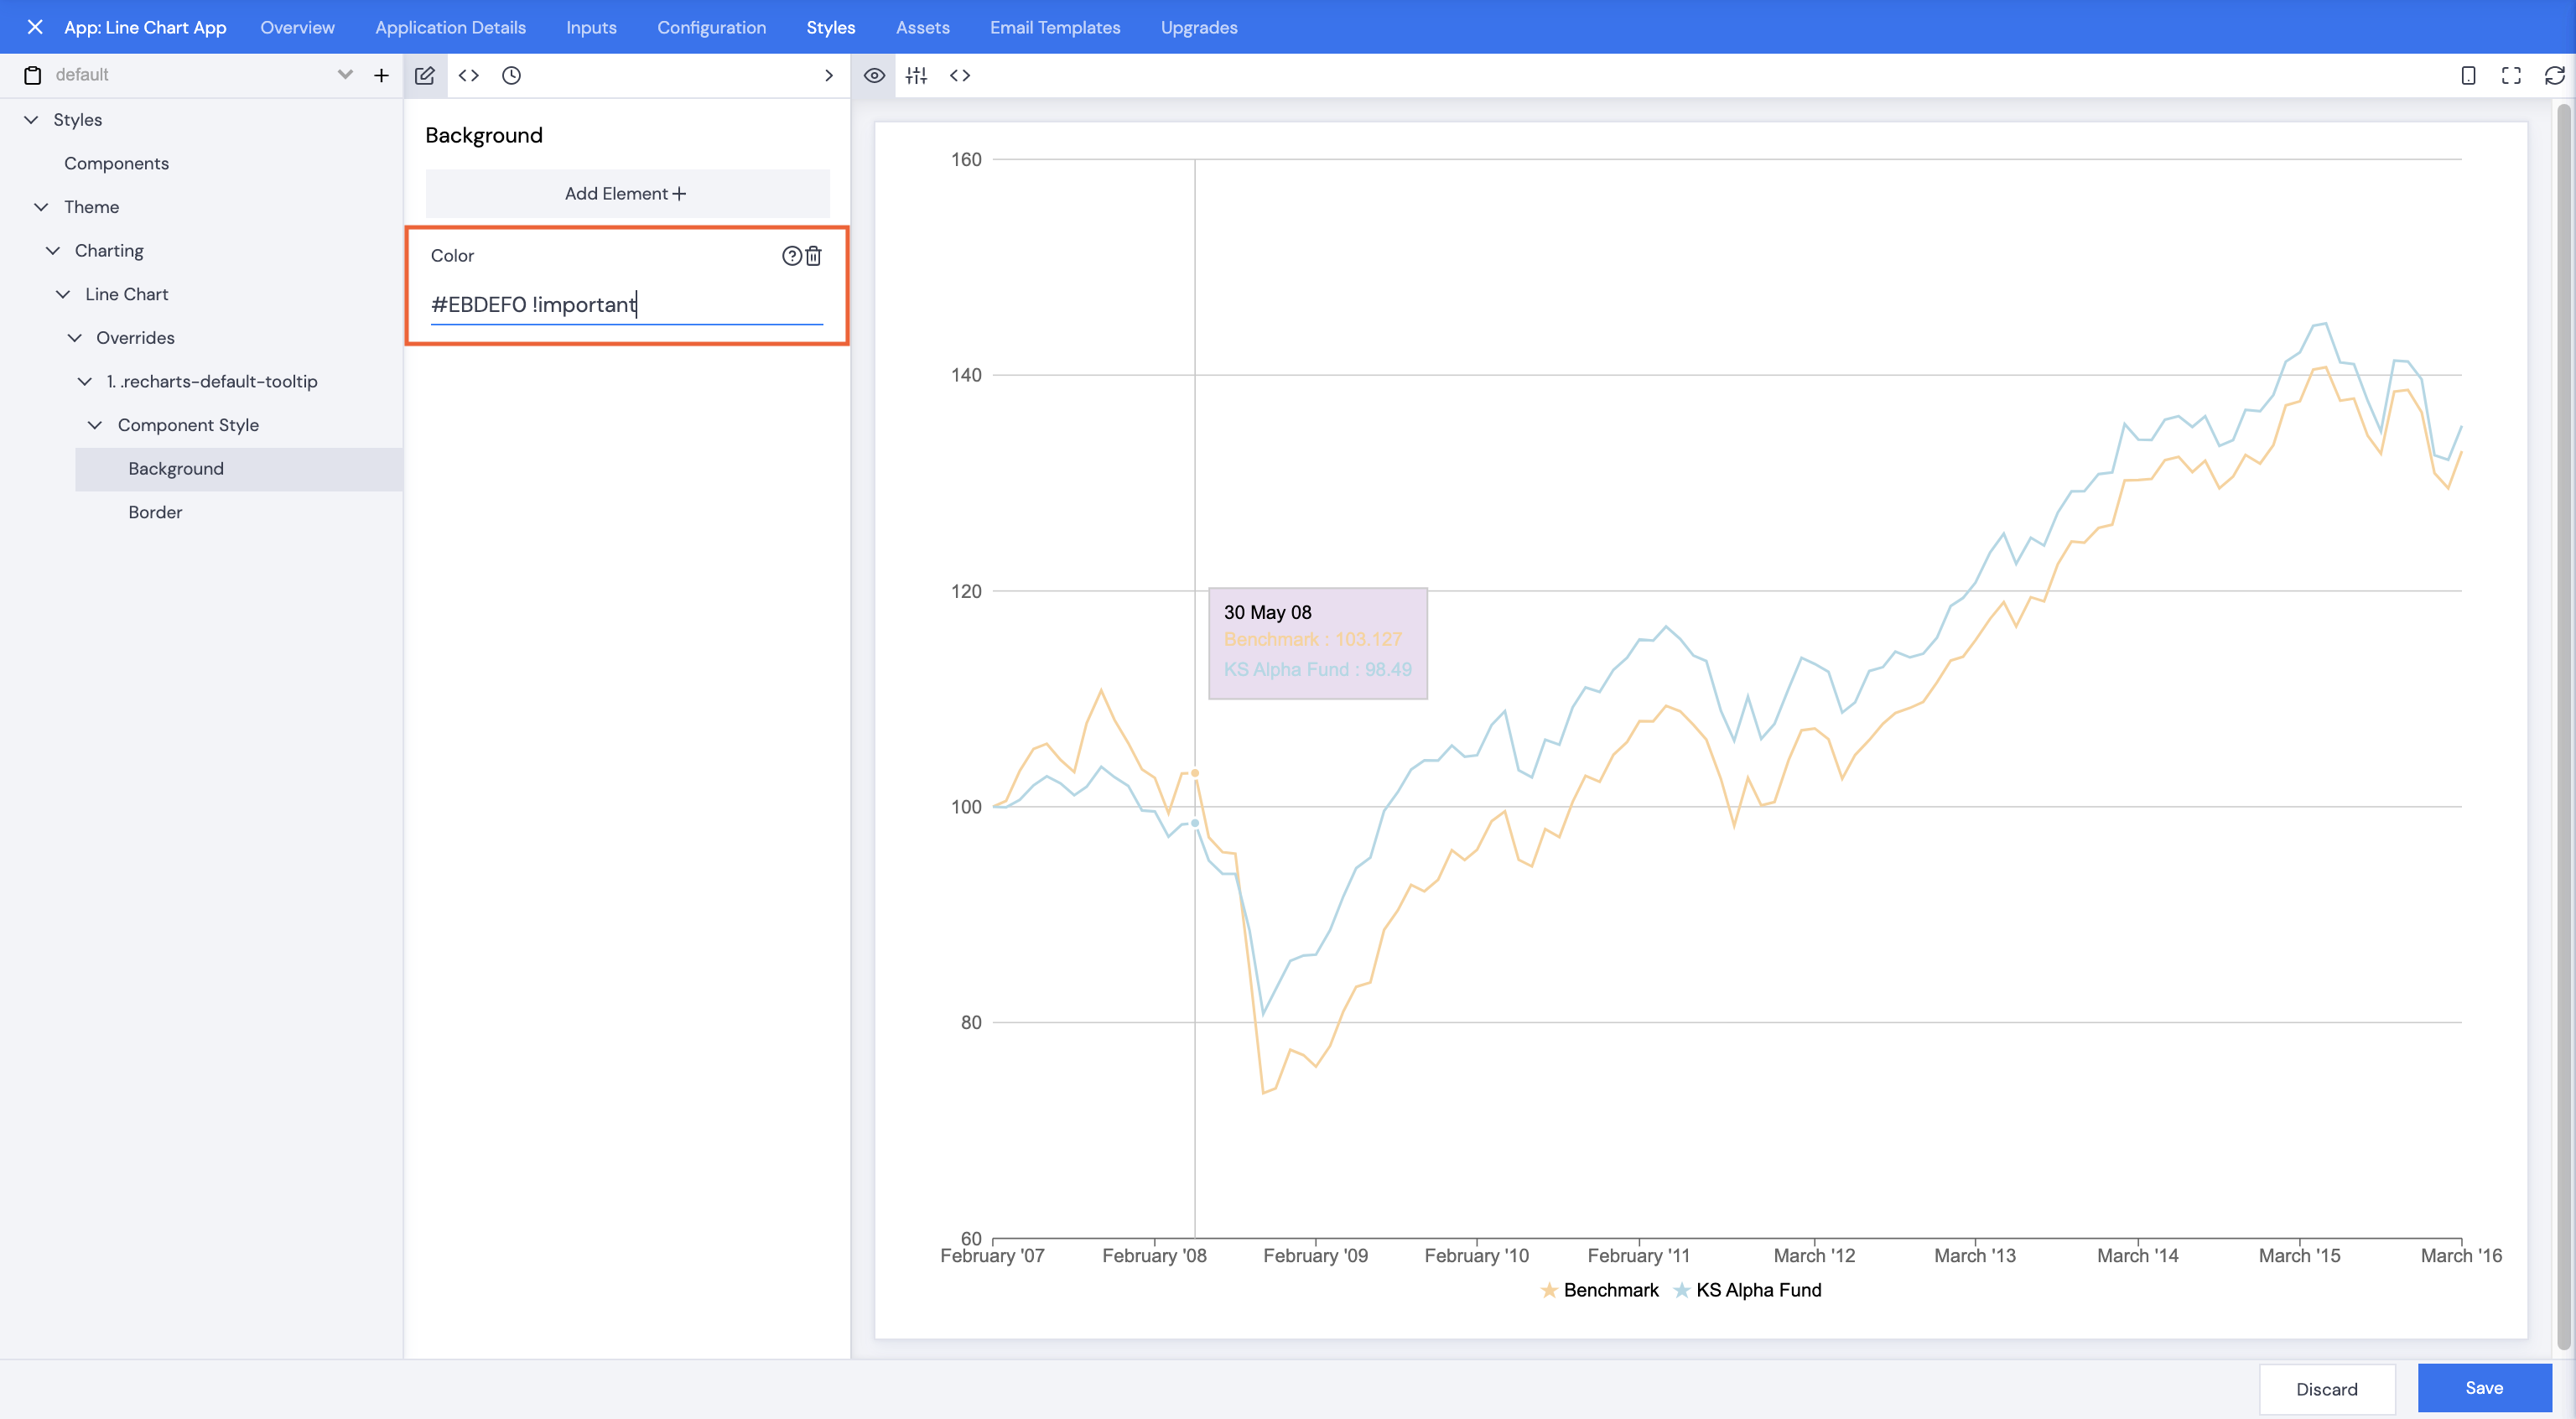
- Type in a Color name or hex code followed by !important, this will override any other potential colors.
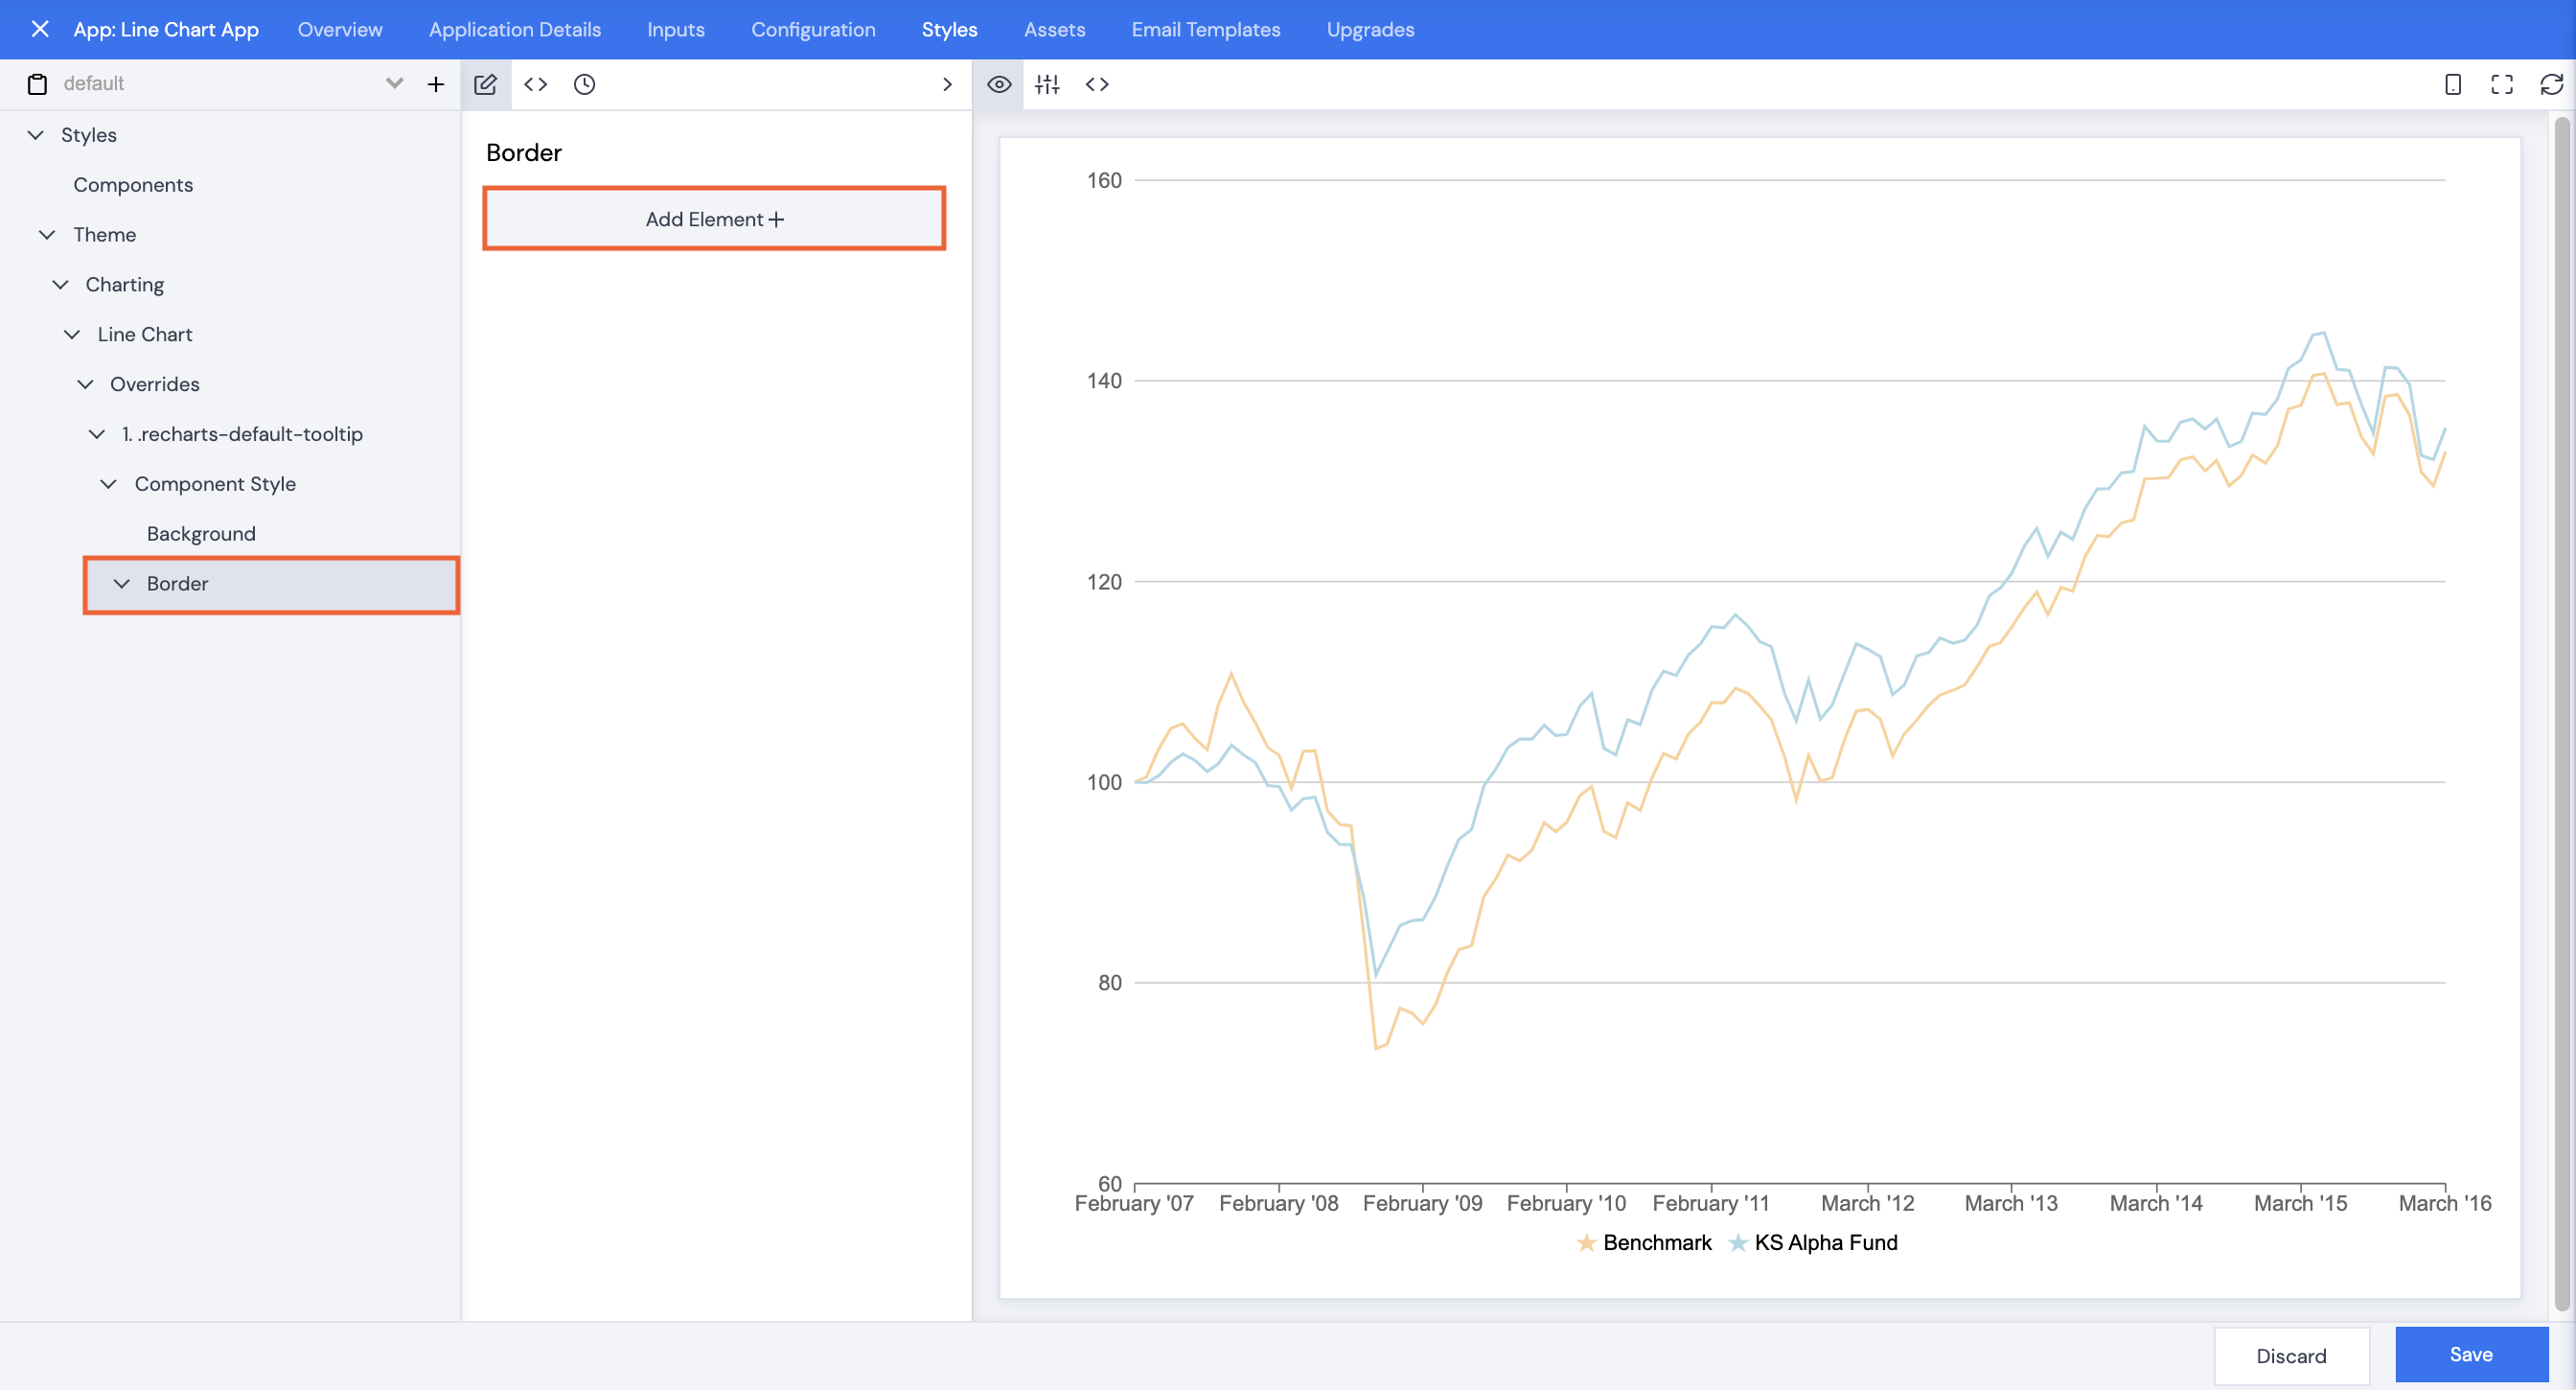
- Browse to Border in the left navigation pane, then click Add Element+.
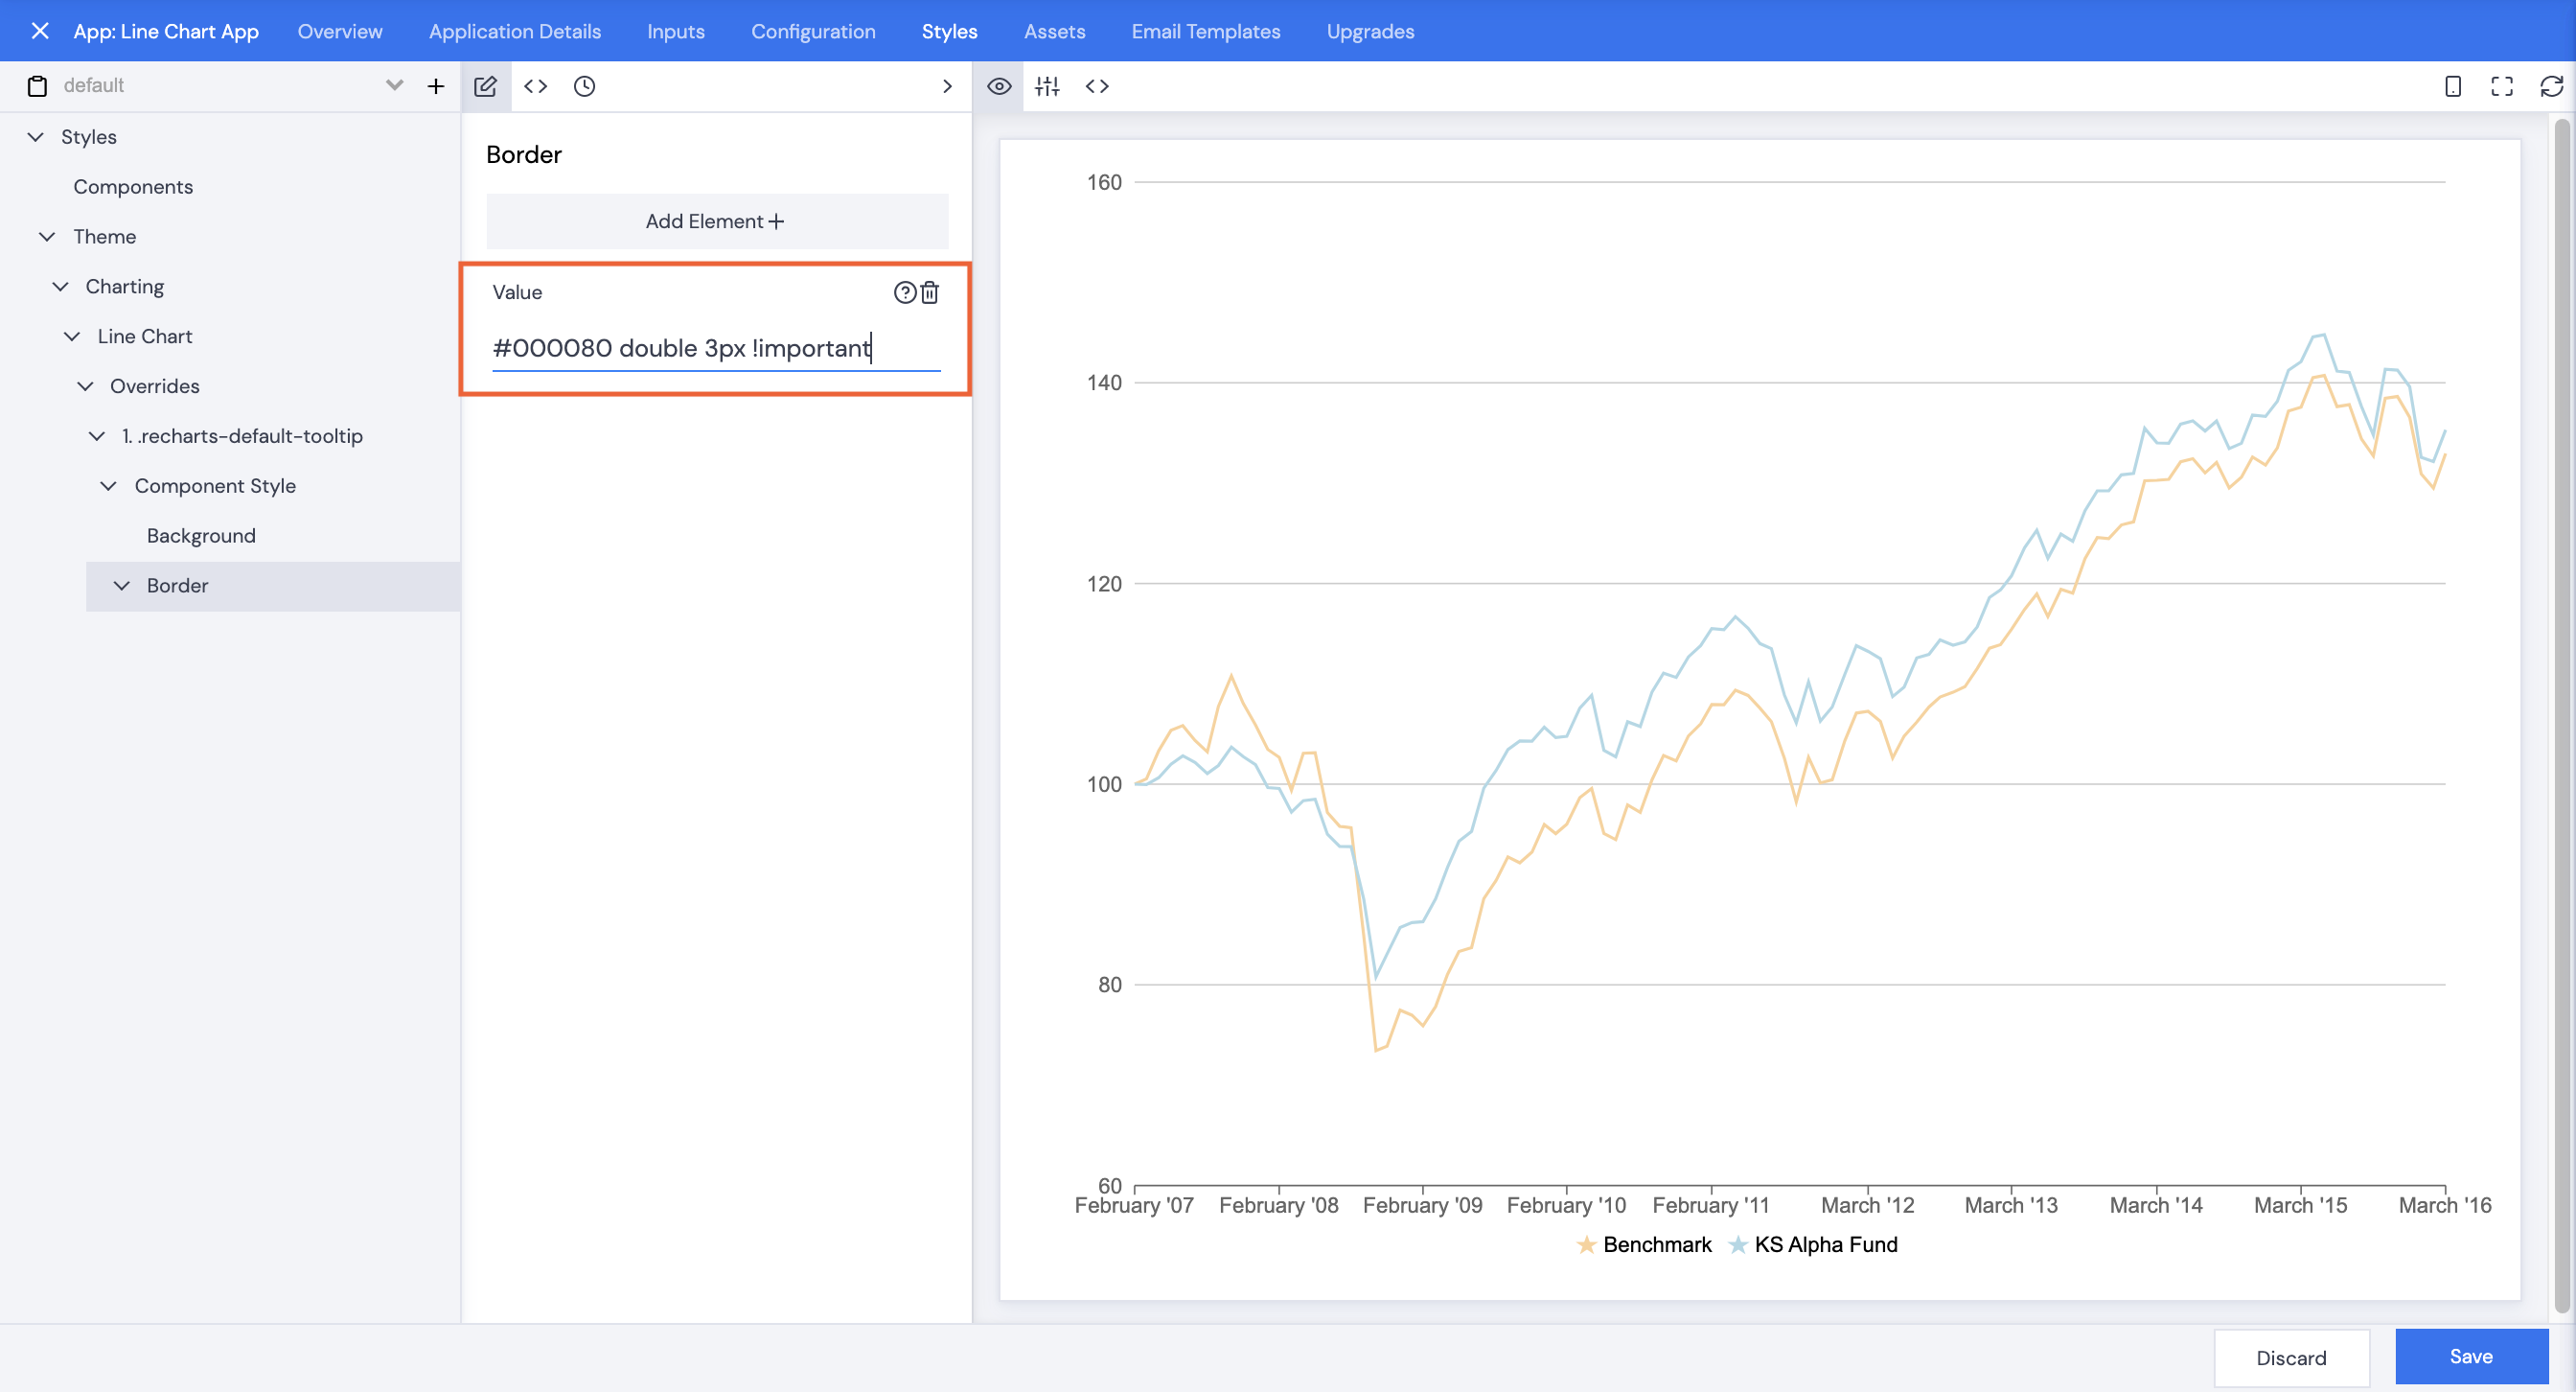
- Select Value, then click Save.
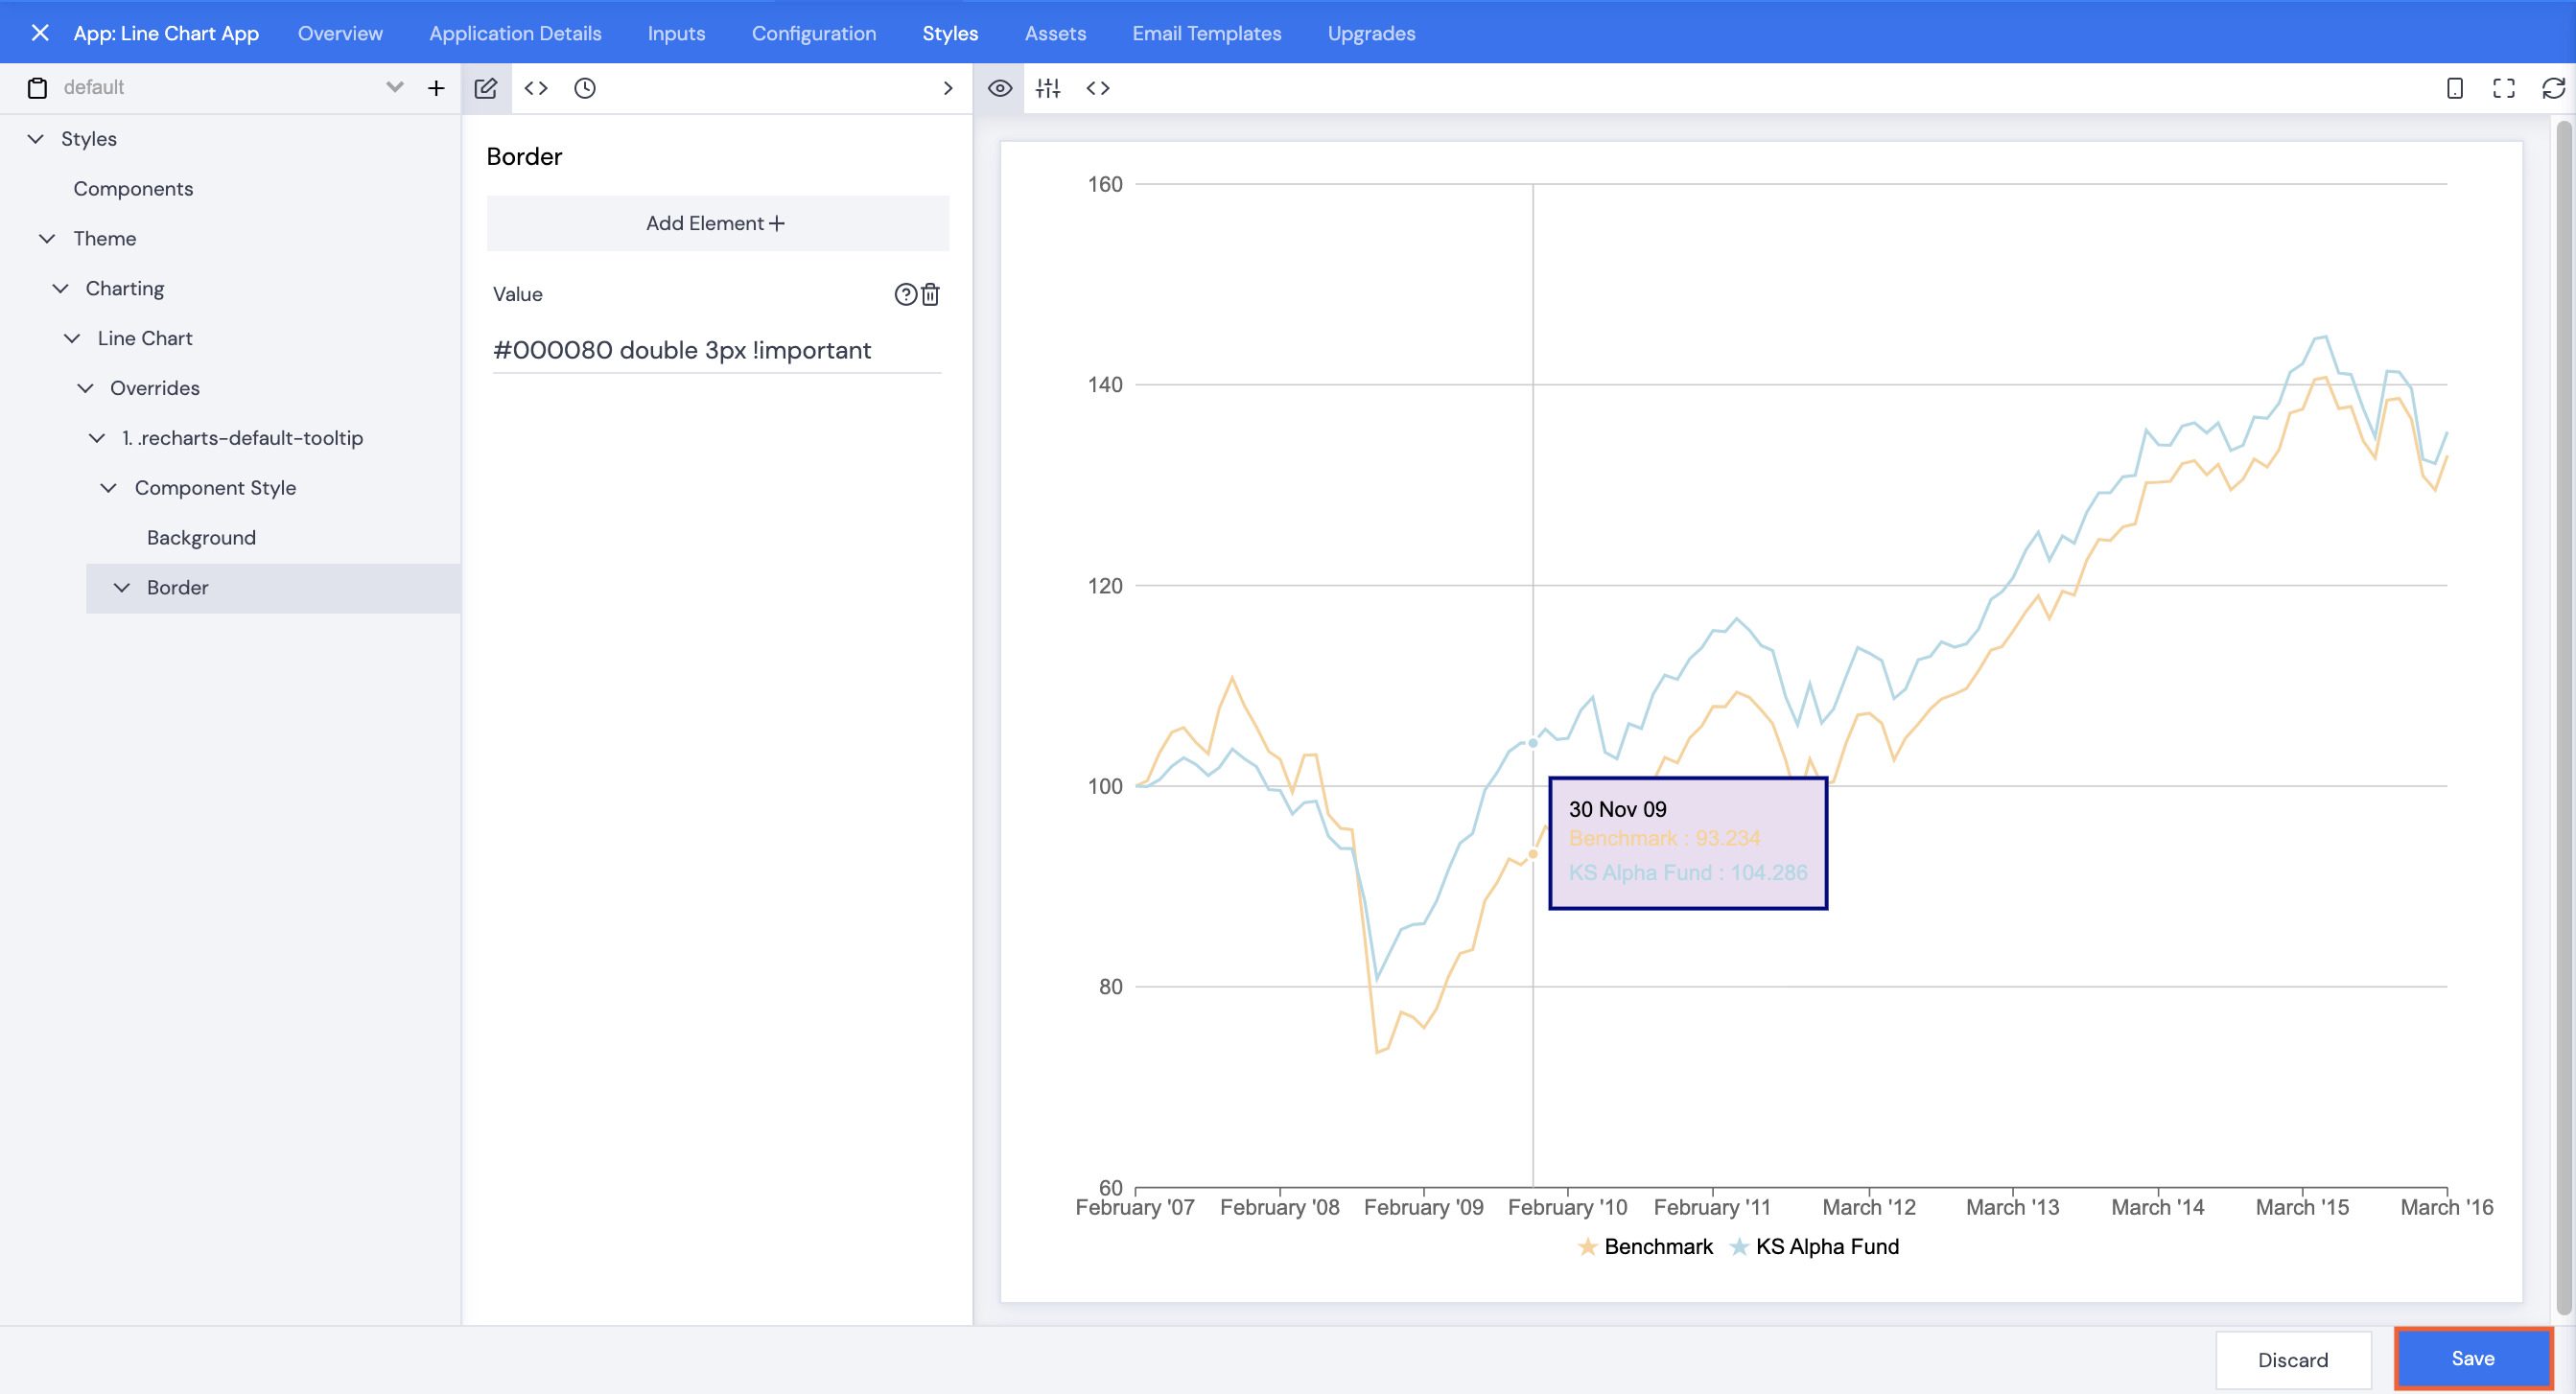
- Type in a Color name or hex code, a border Style and a value for Width in pixels followed by !important.
- Click Save.
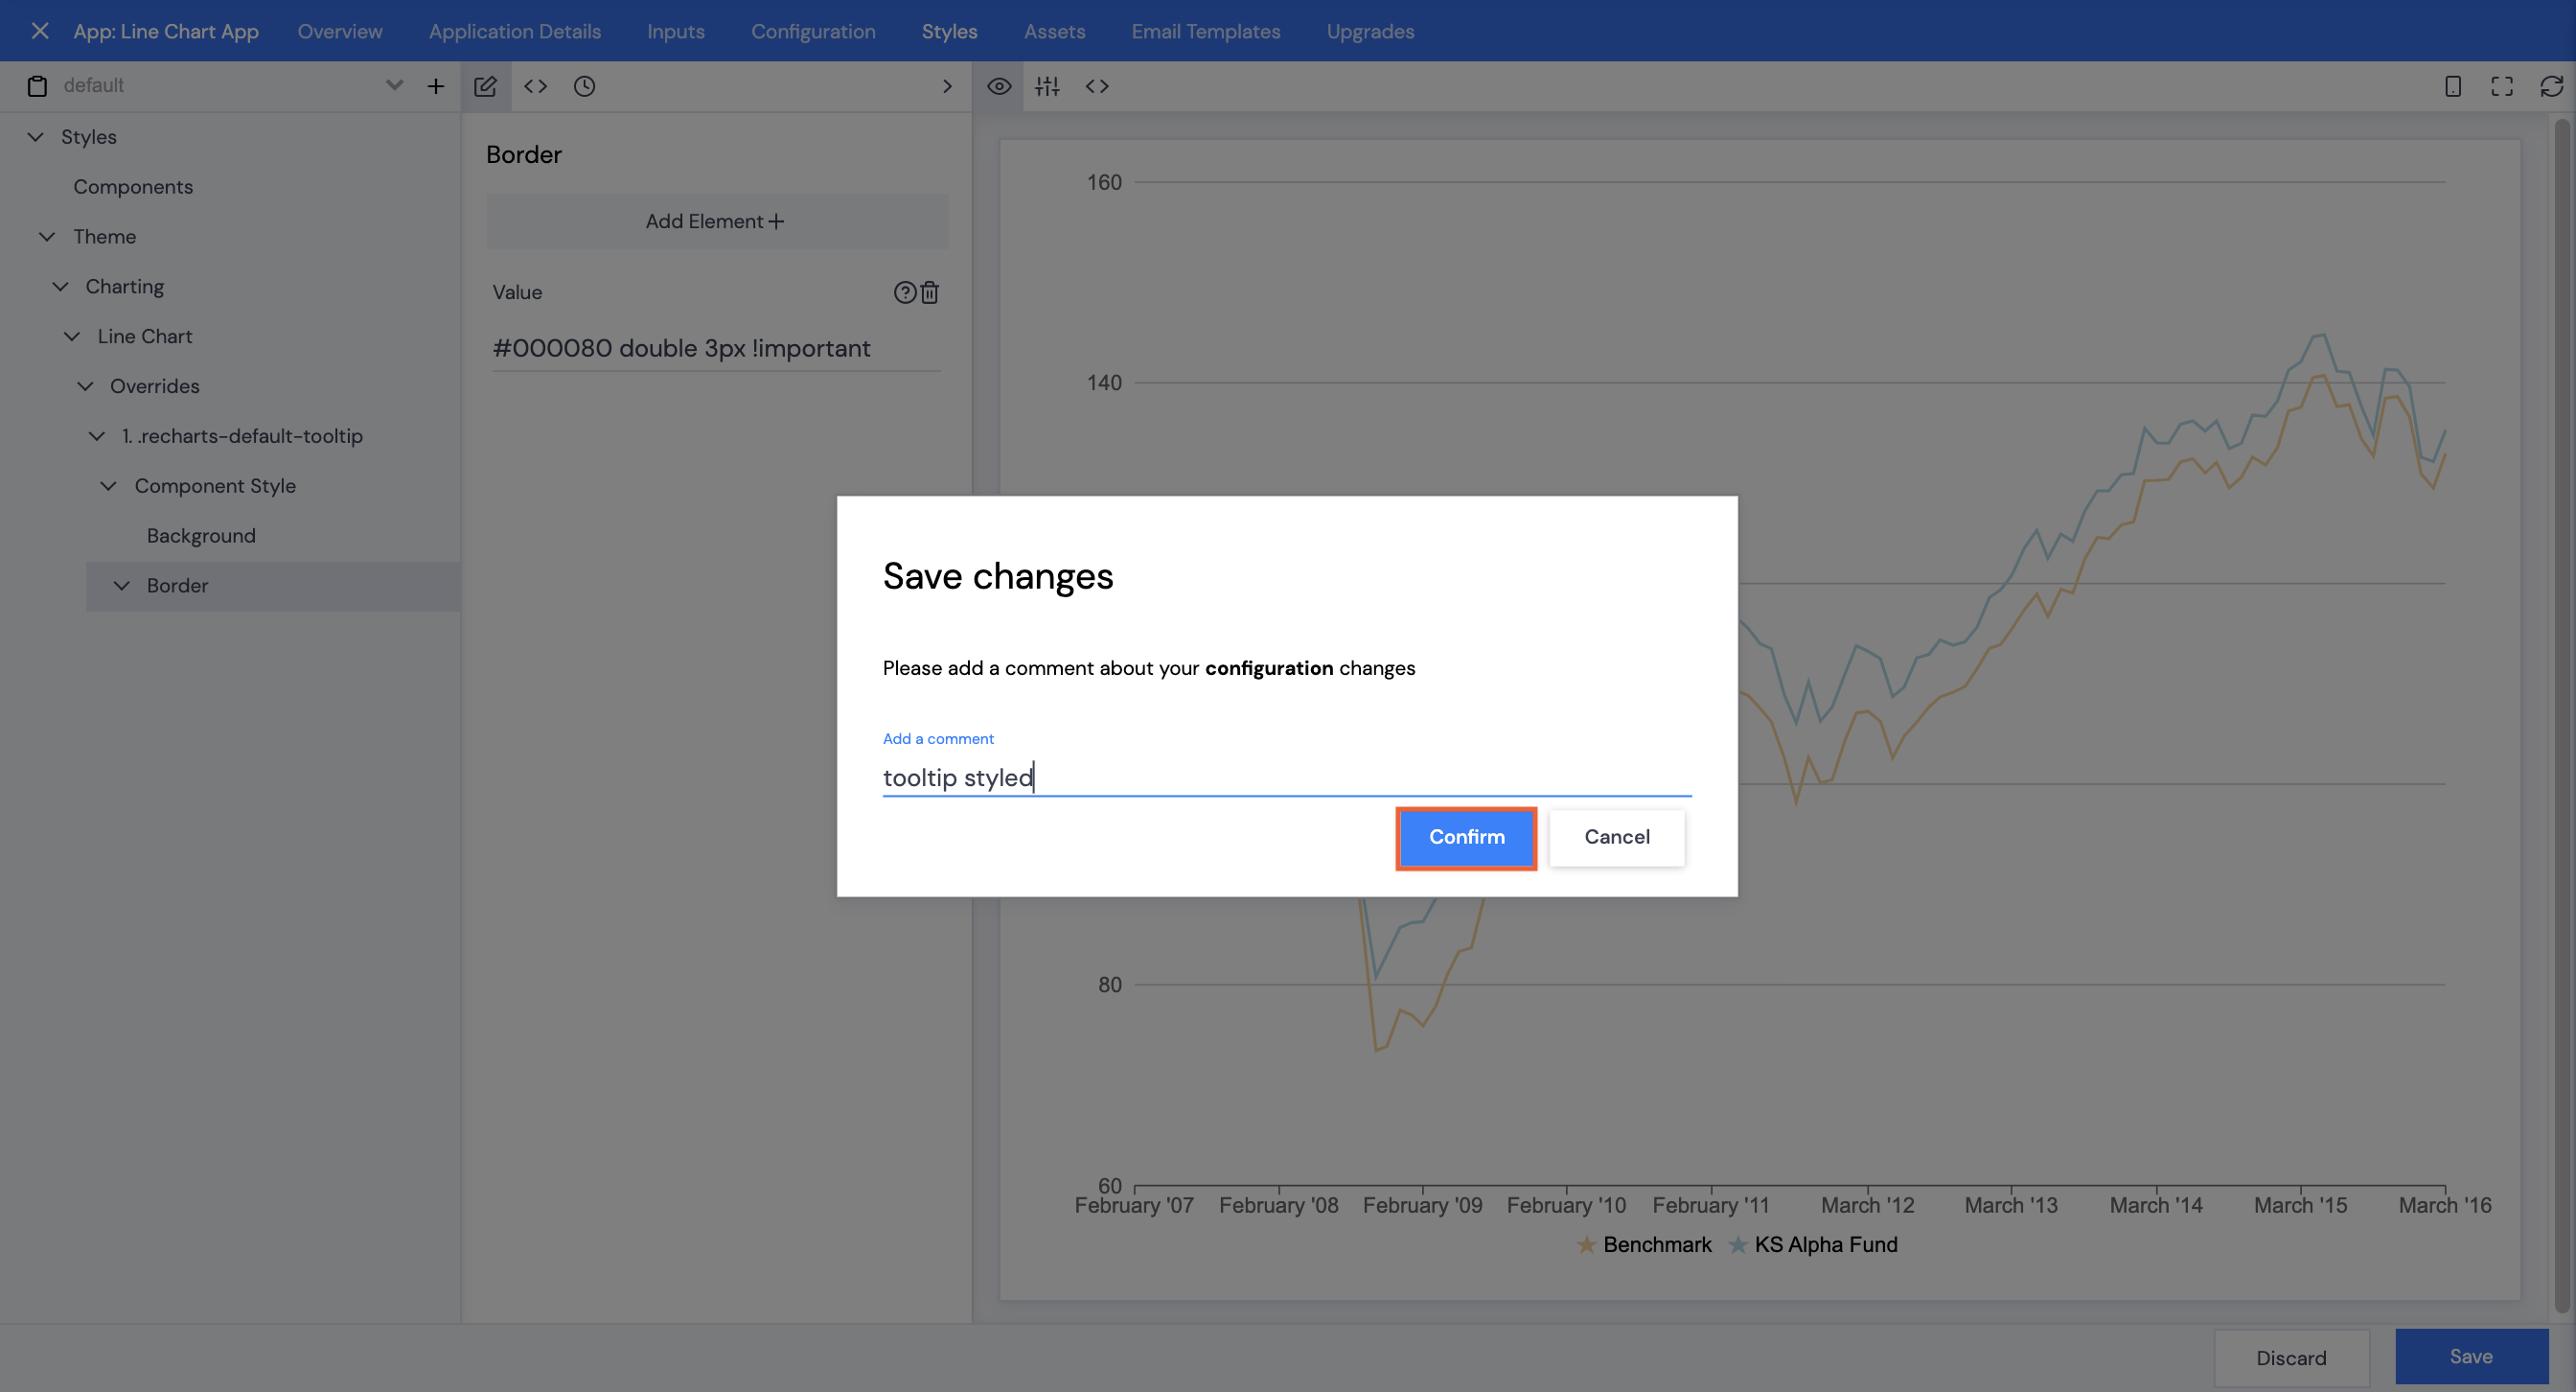
- Type in a comment, then click Confirm.
Ticker Line/Cursor
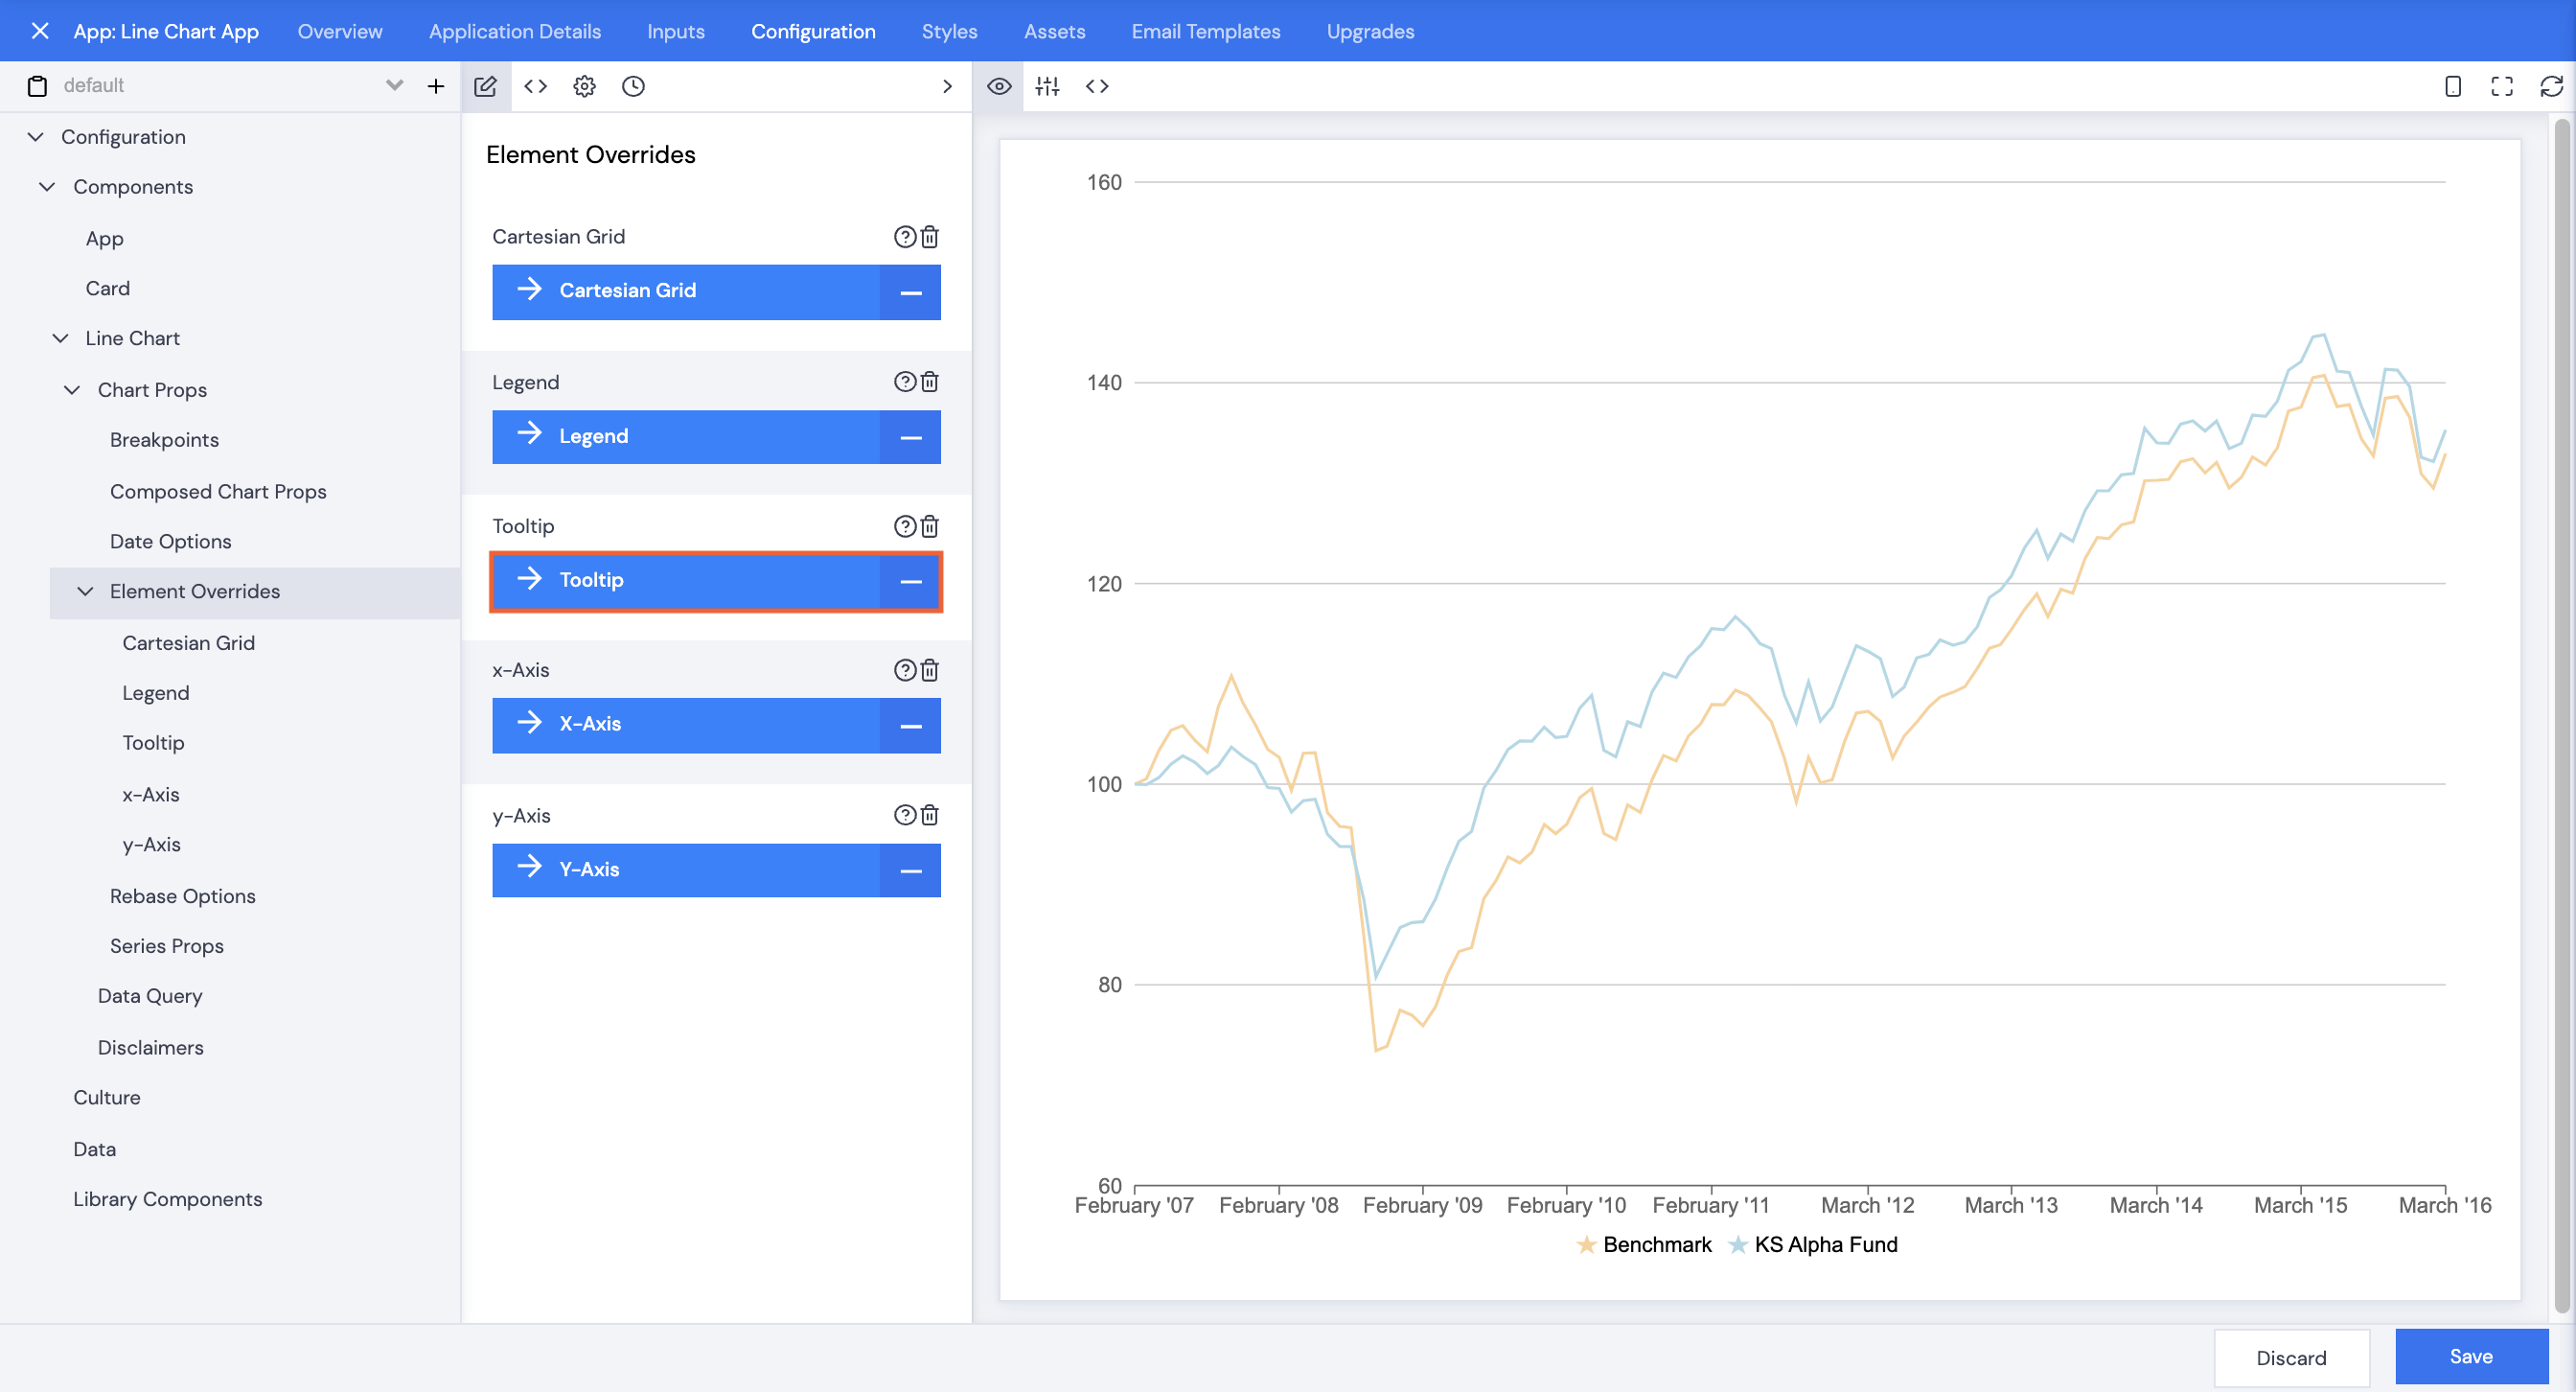
- Browse to Components | Line Chart | Chart Props, then click Element Overrides.
- Click Tooltip.
- Use the dropdown arrow below Cursor to select boolean.
- Leave the checkbox unchecked.
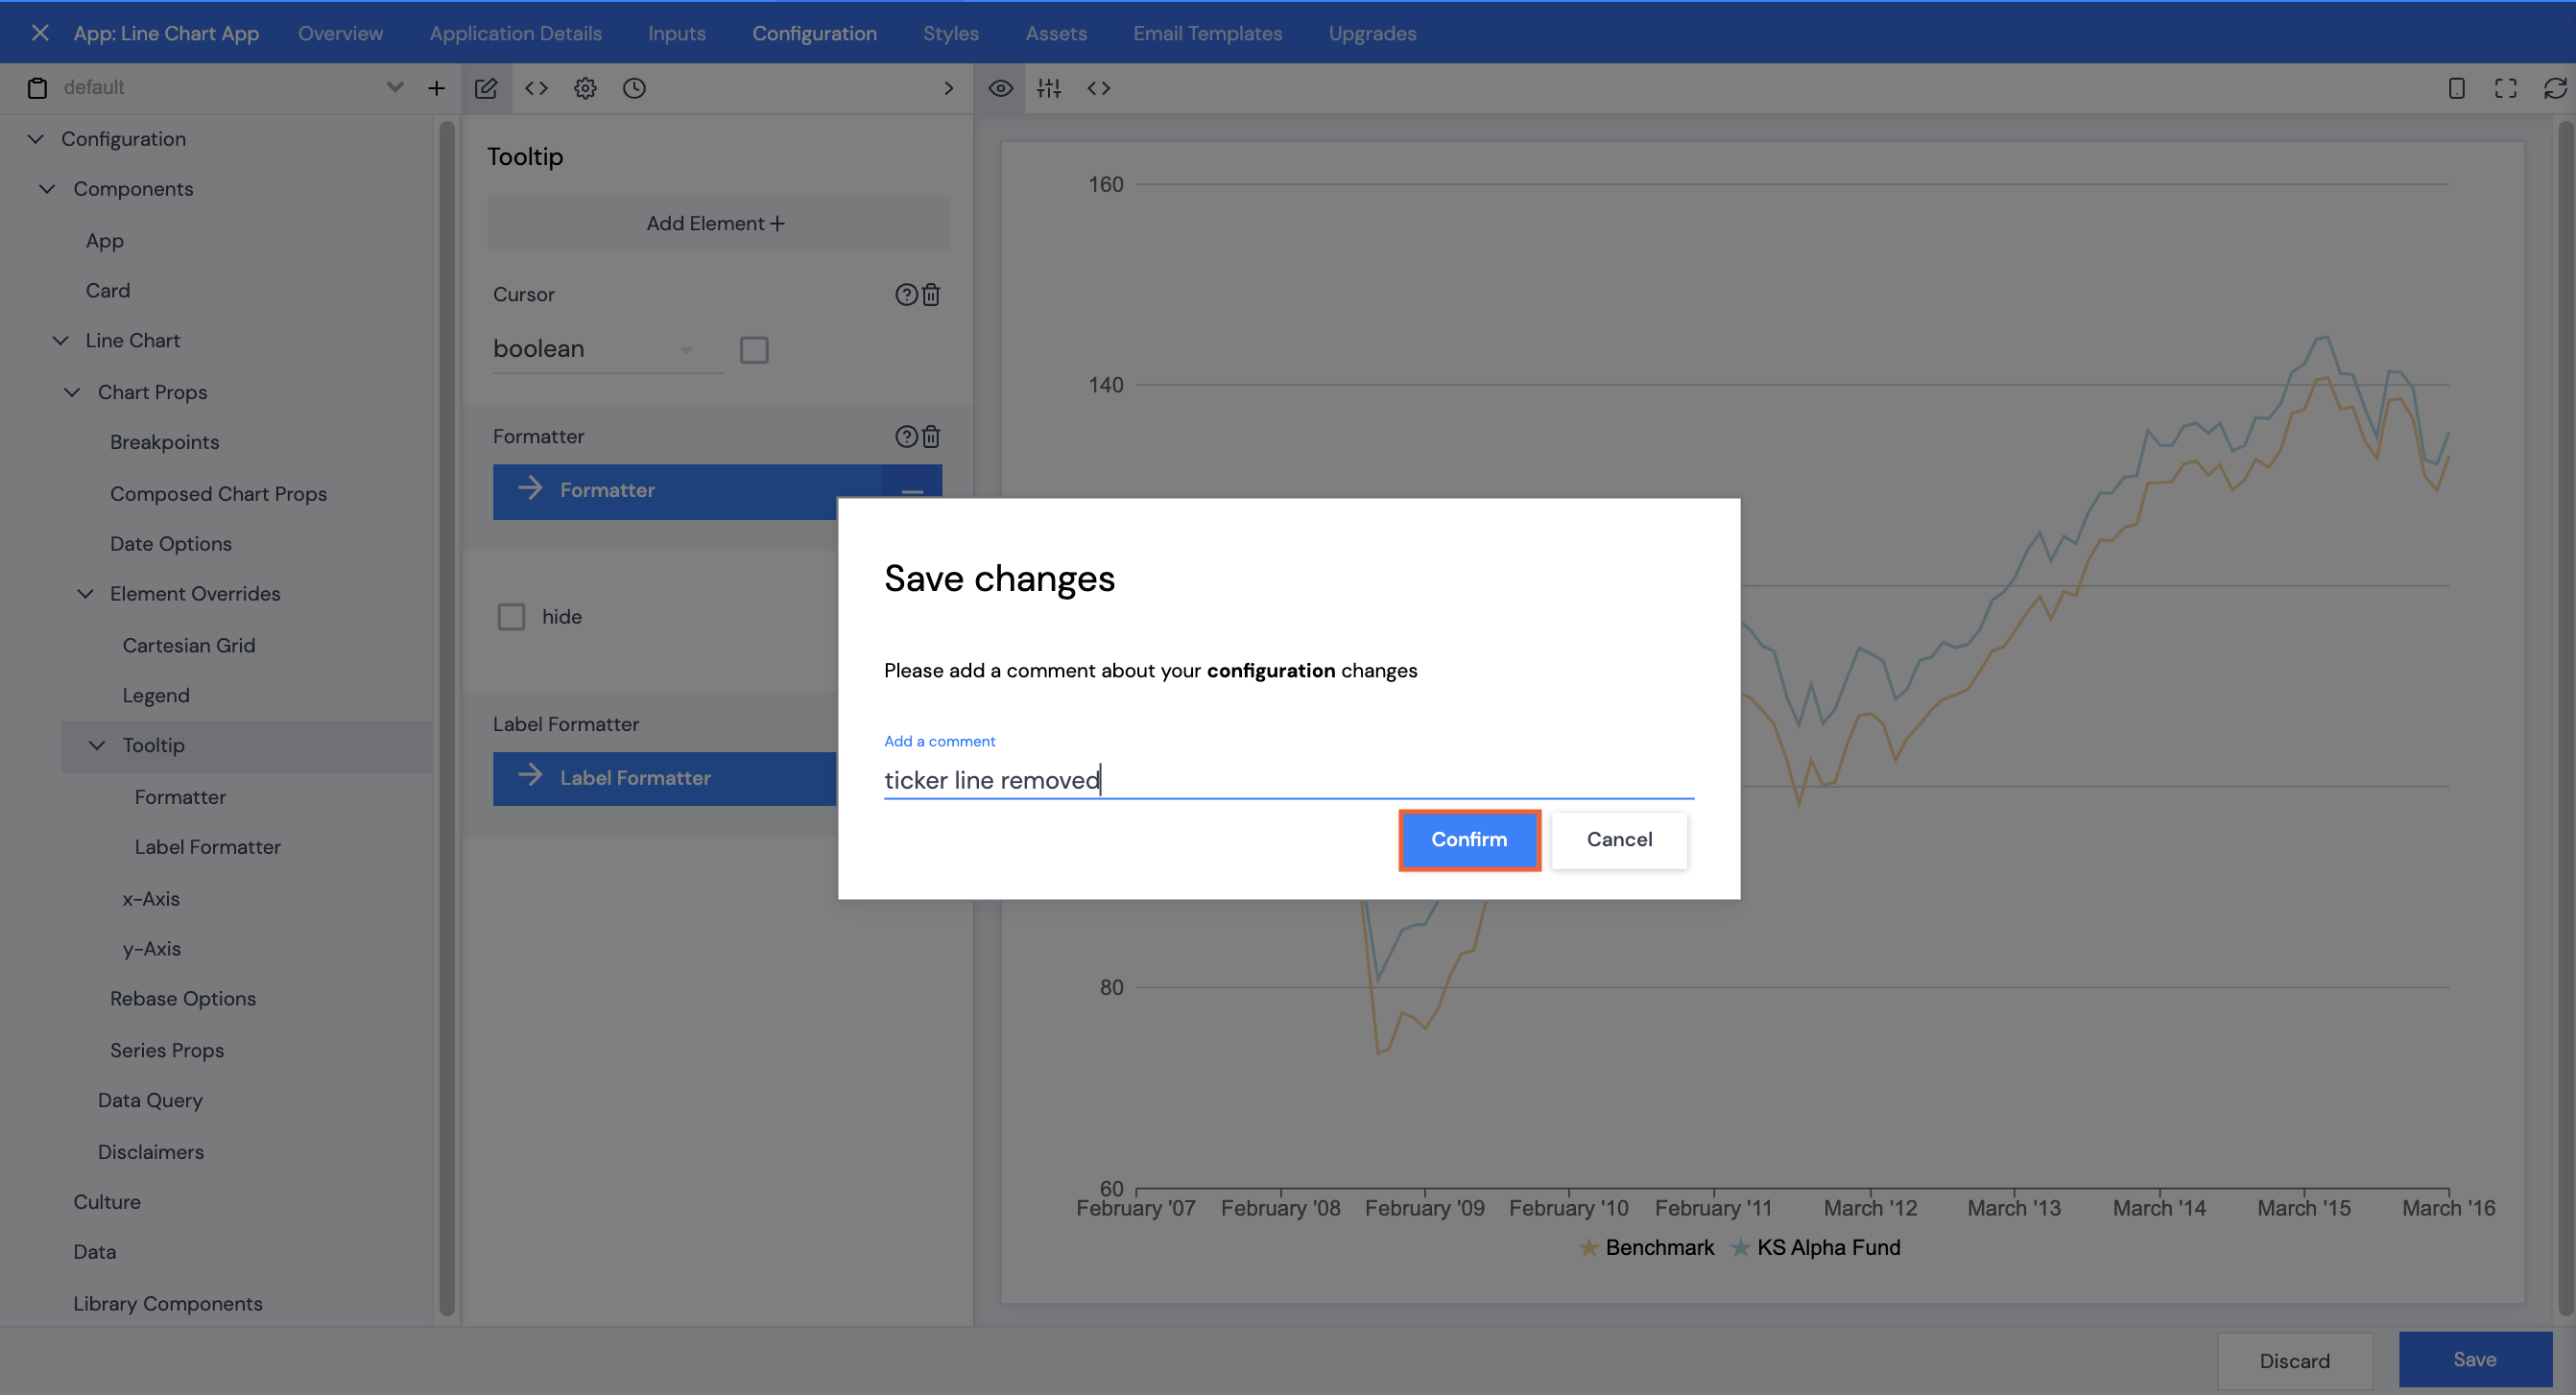
- Click Save.
- Type in a comment, then click Confirm.
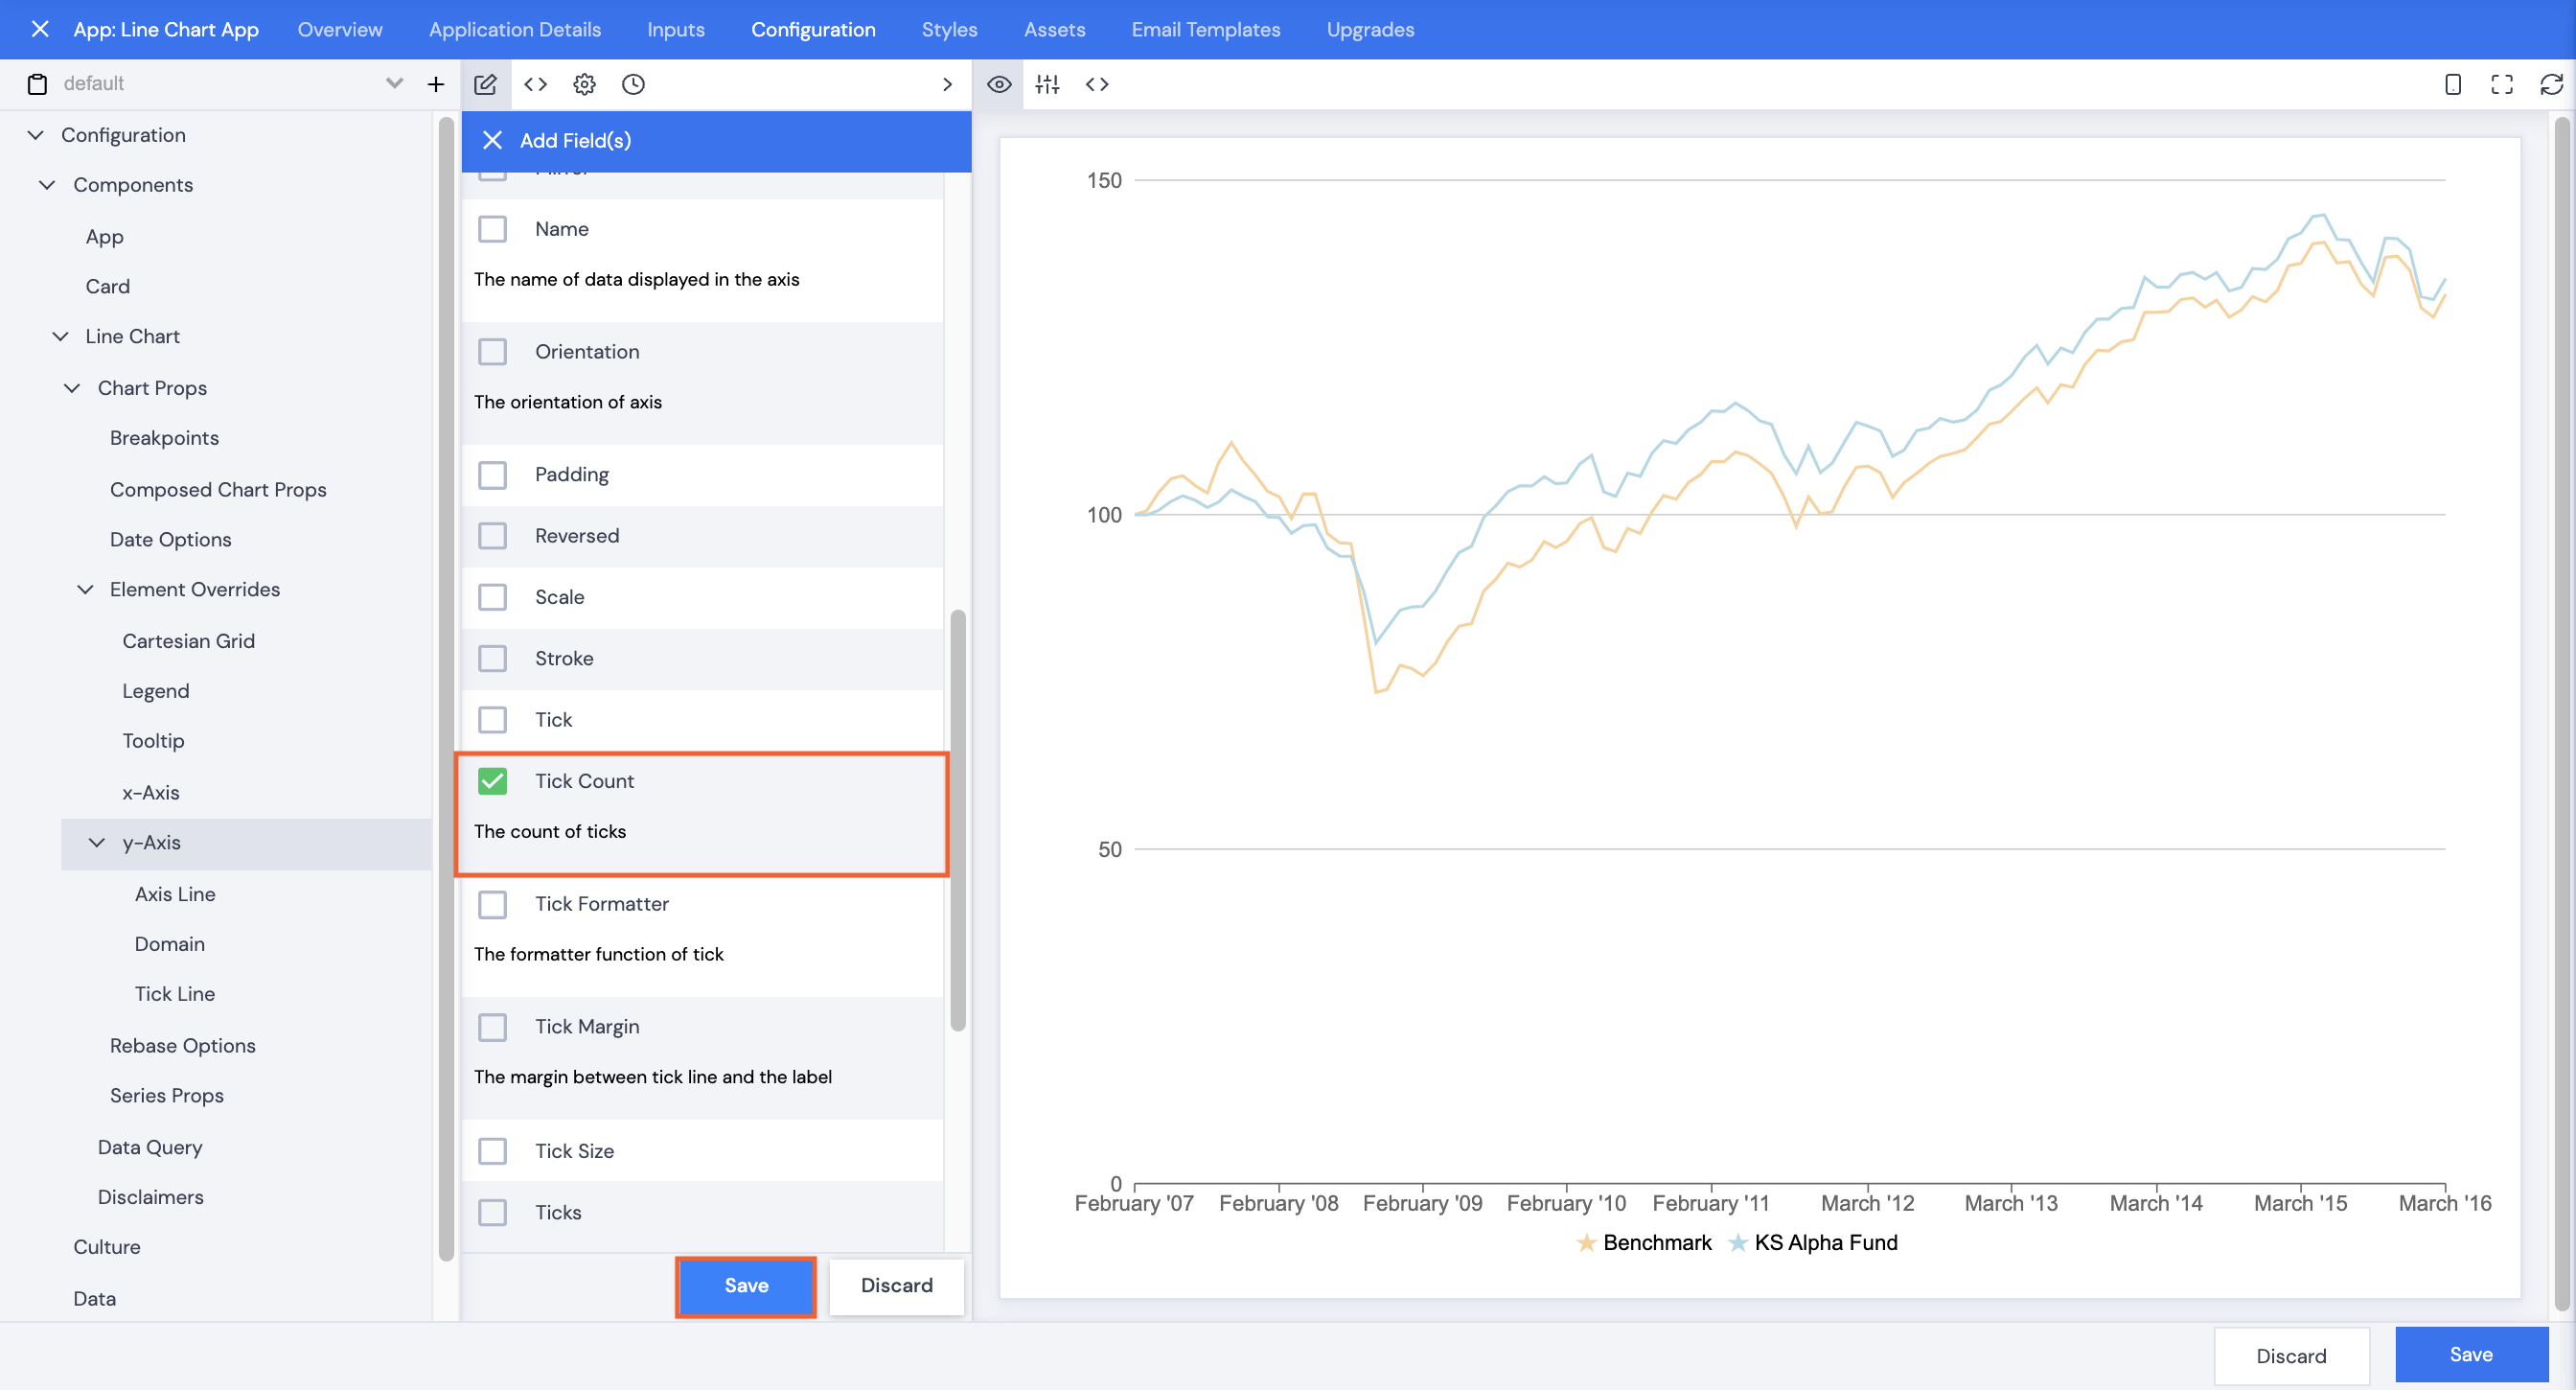
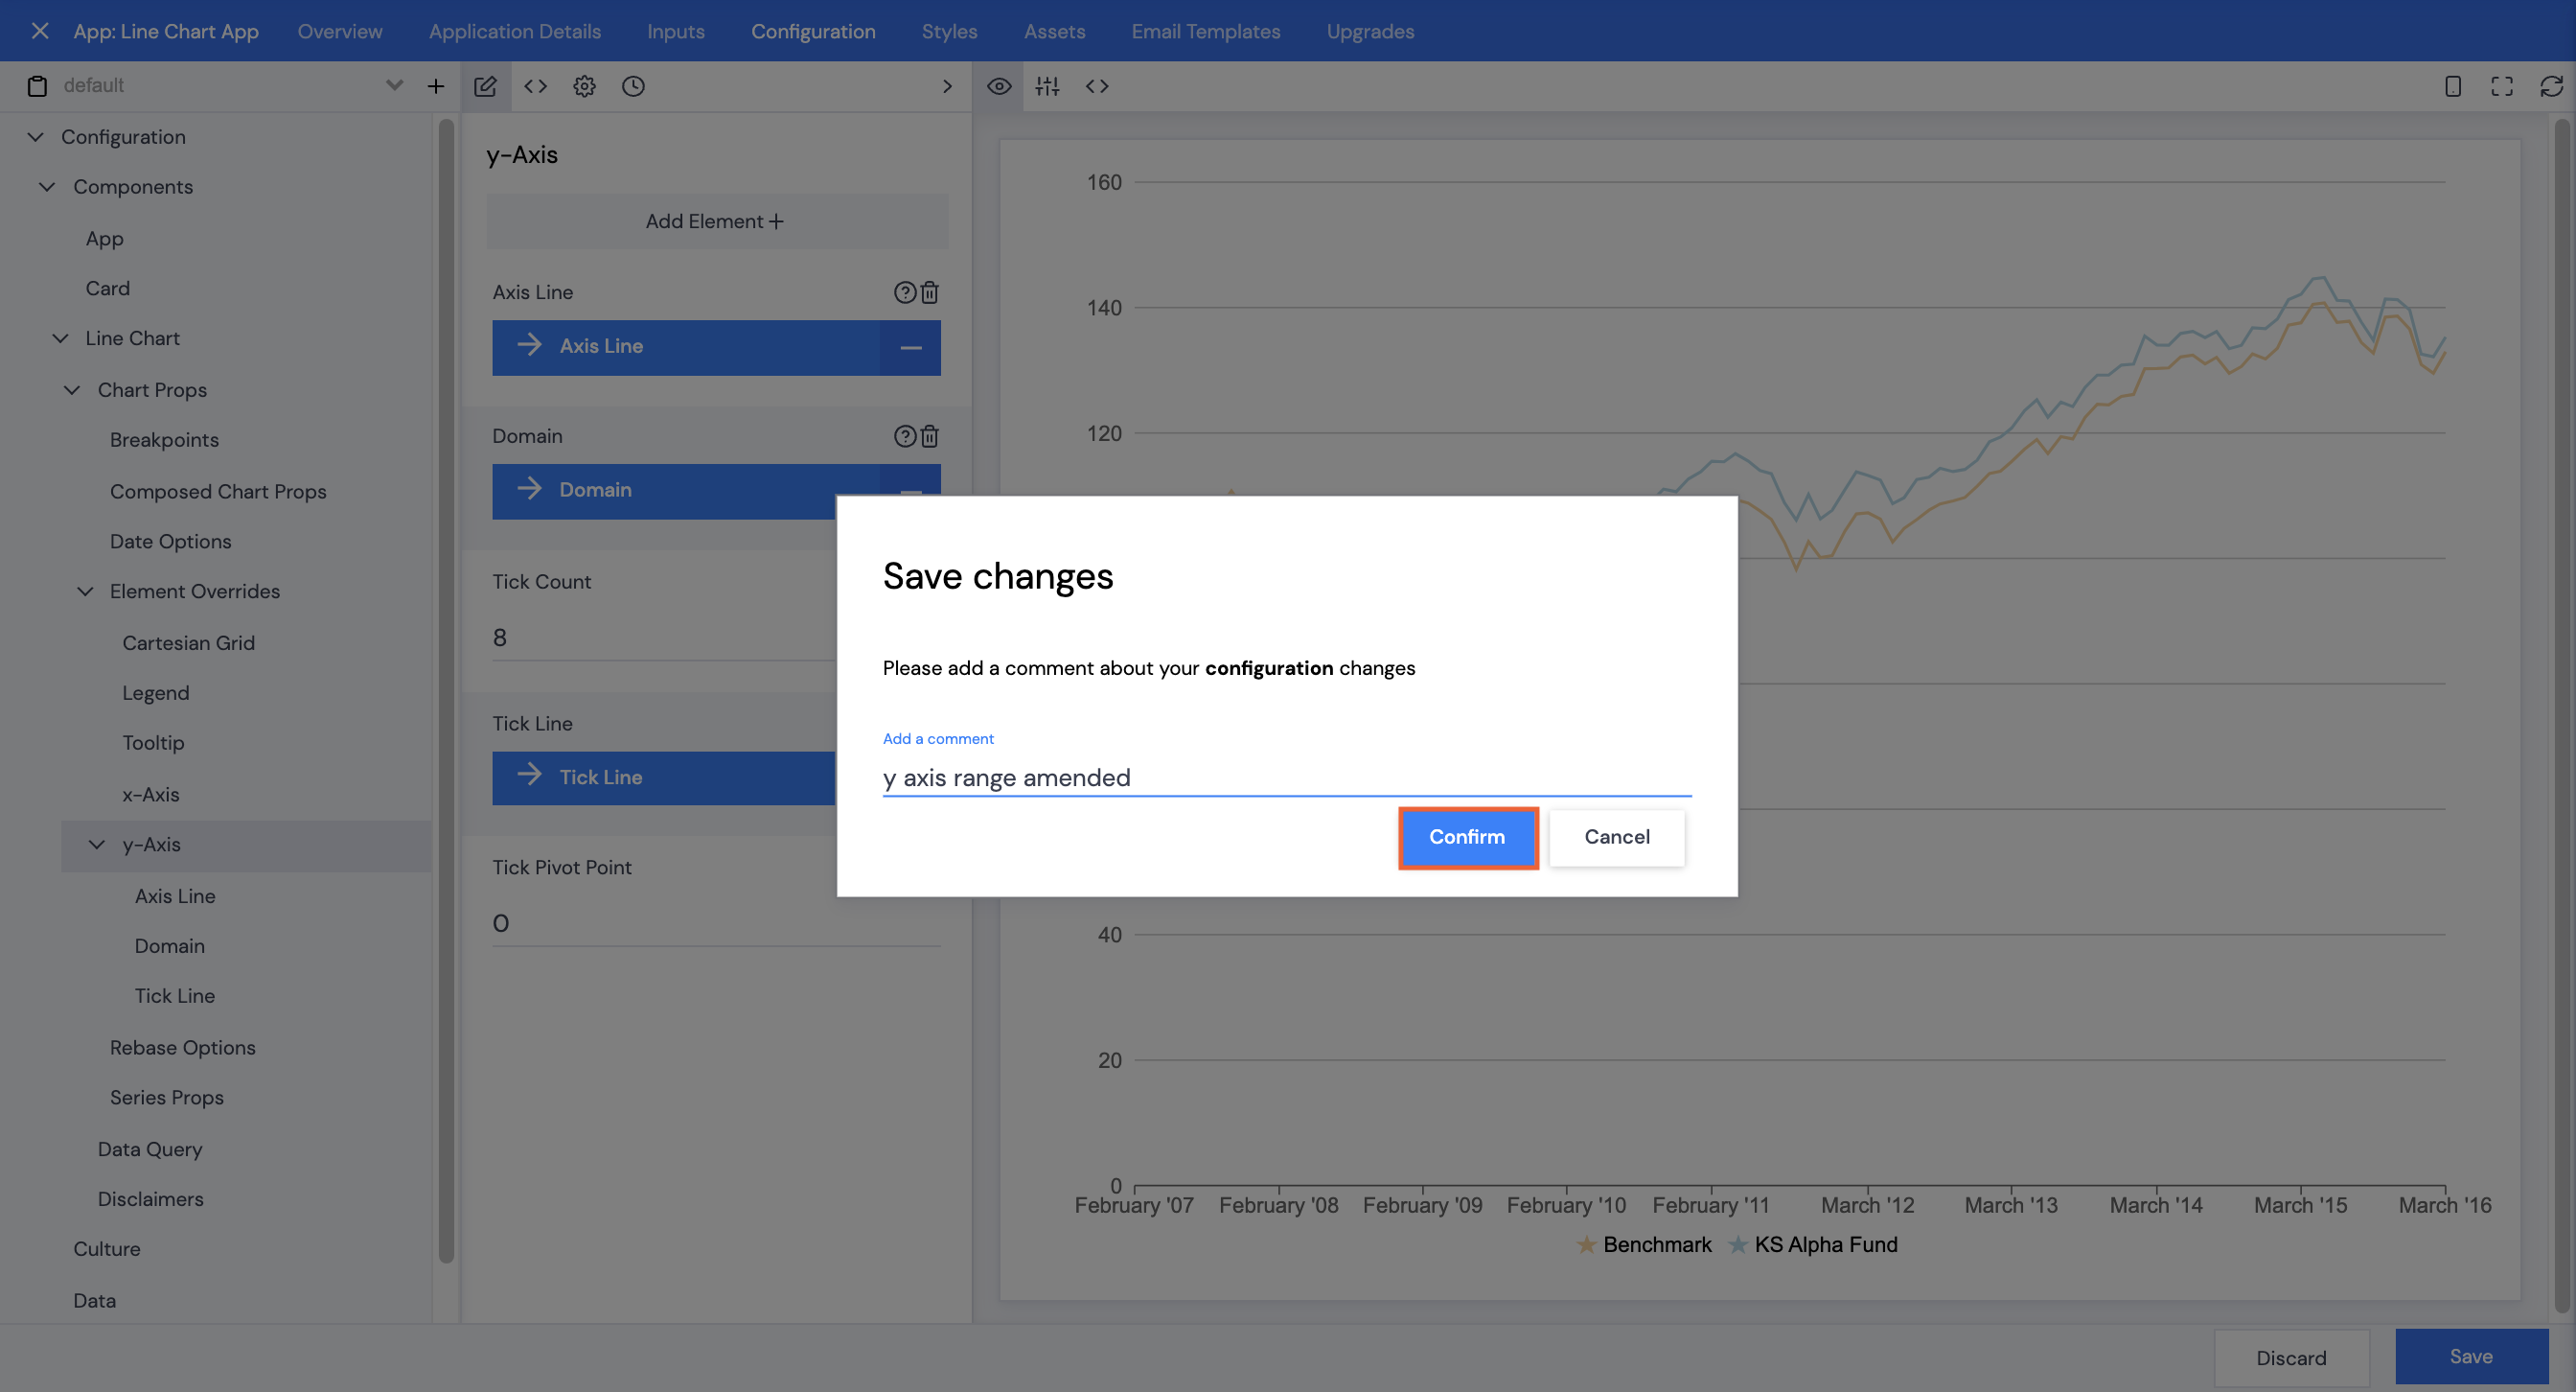
Y-Axis Range
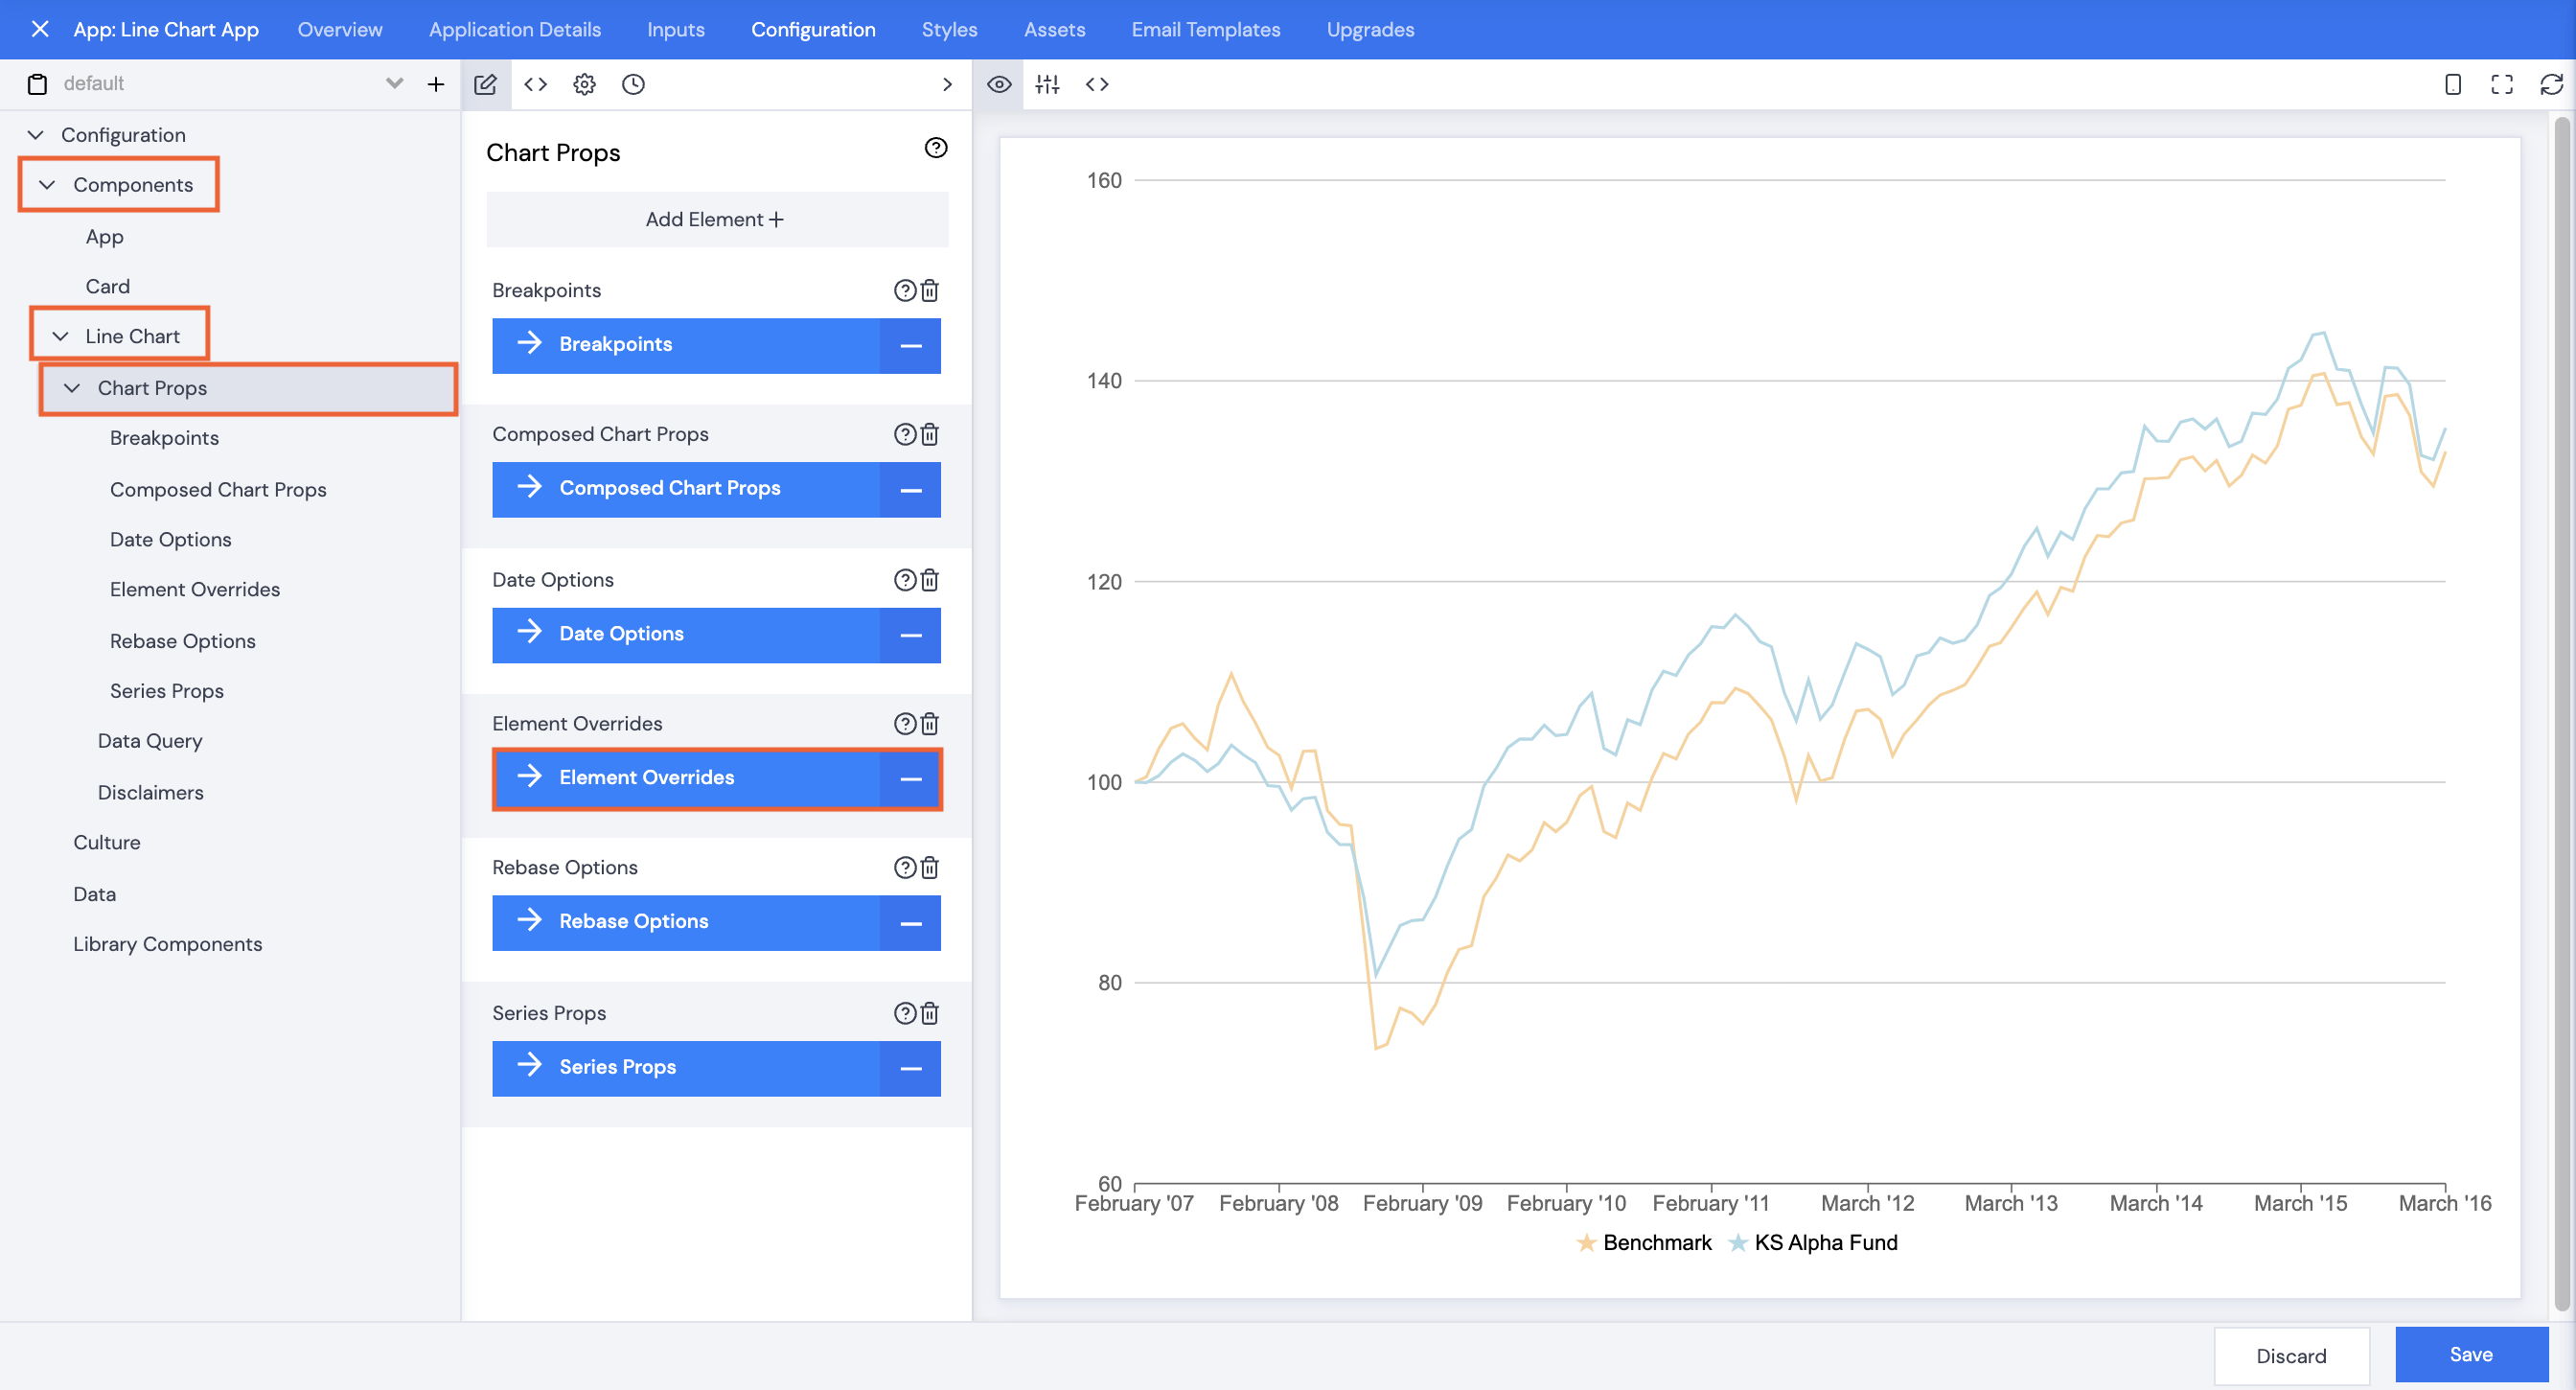
- Browse to Components | Line Chart | Chart Props, then click Element Overrides.
- Scroll or search to select Overrides, then click Save.
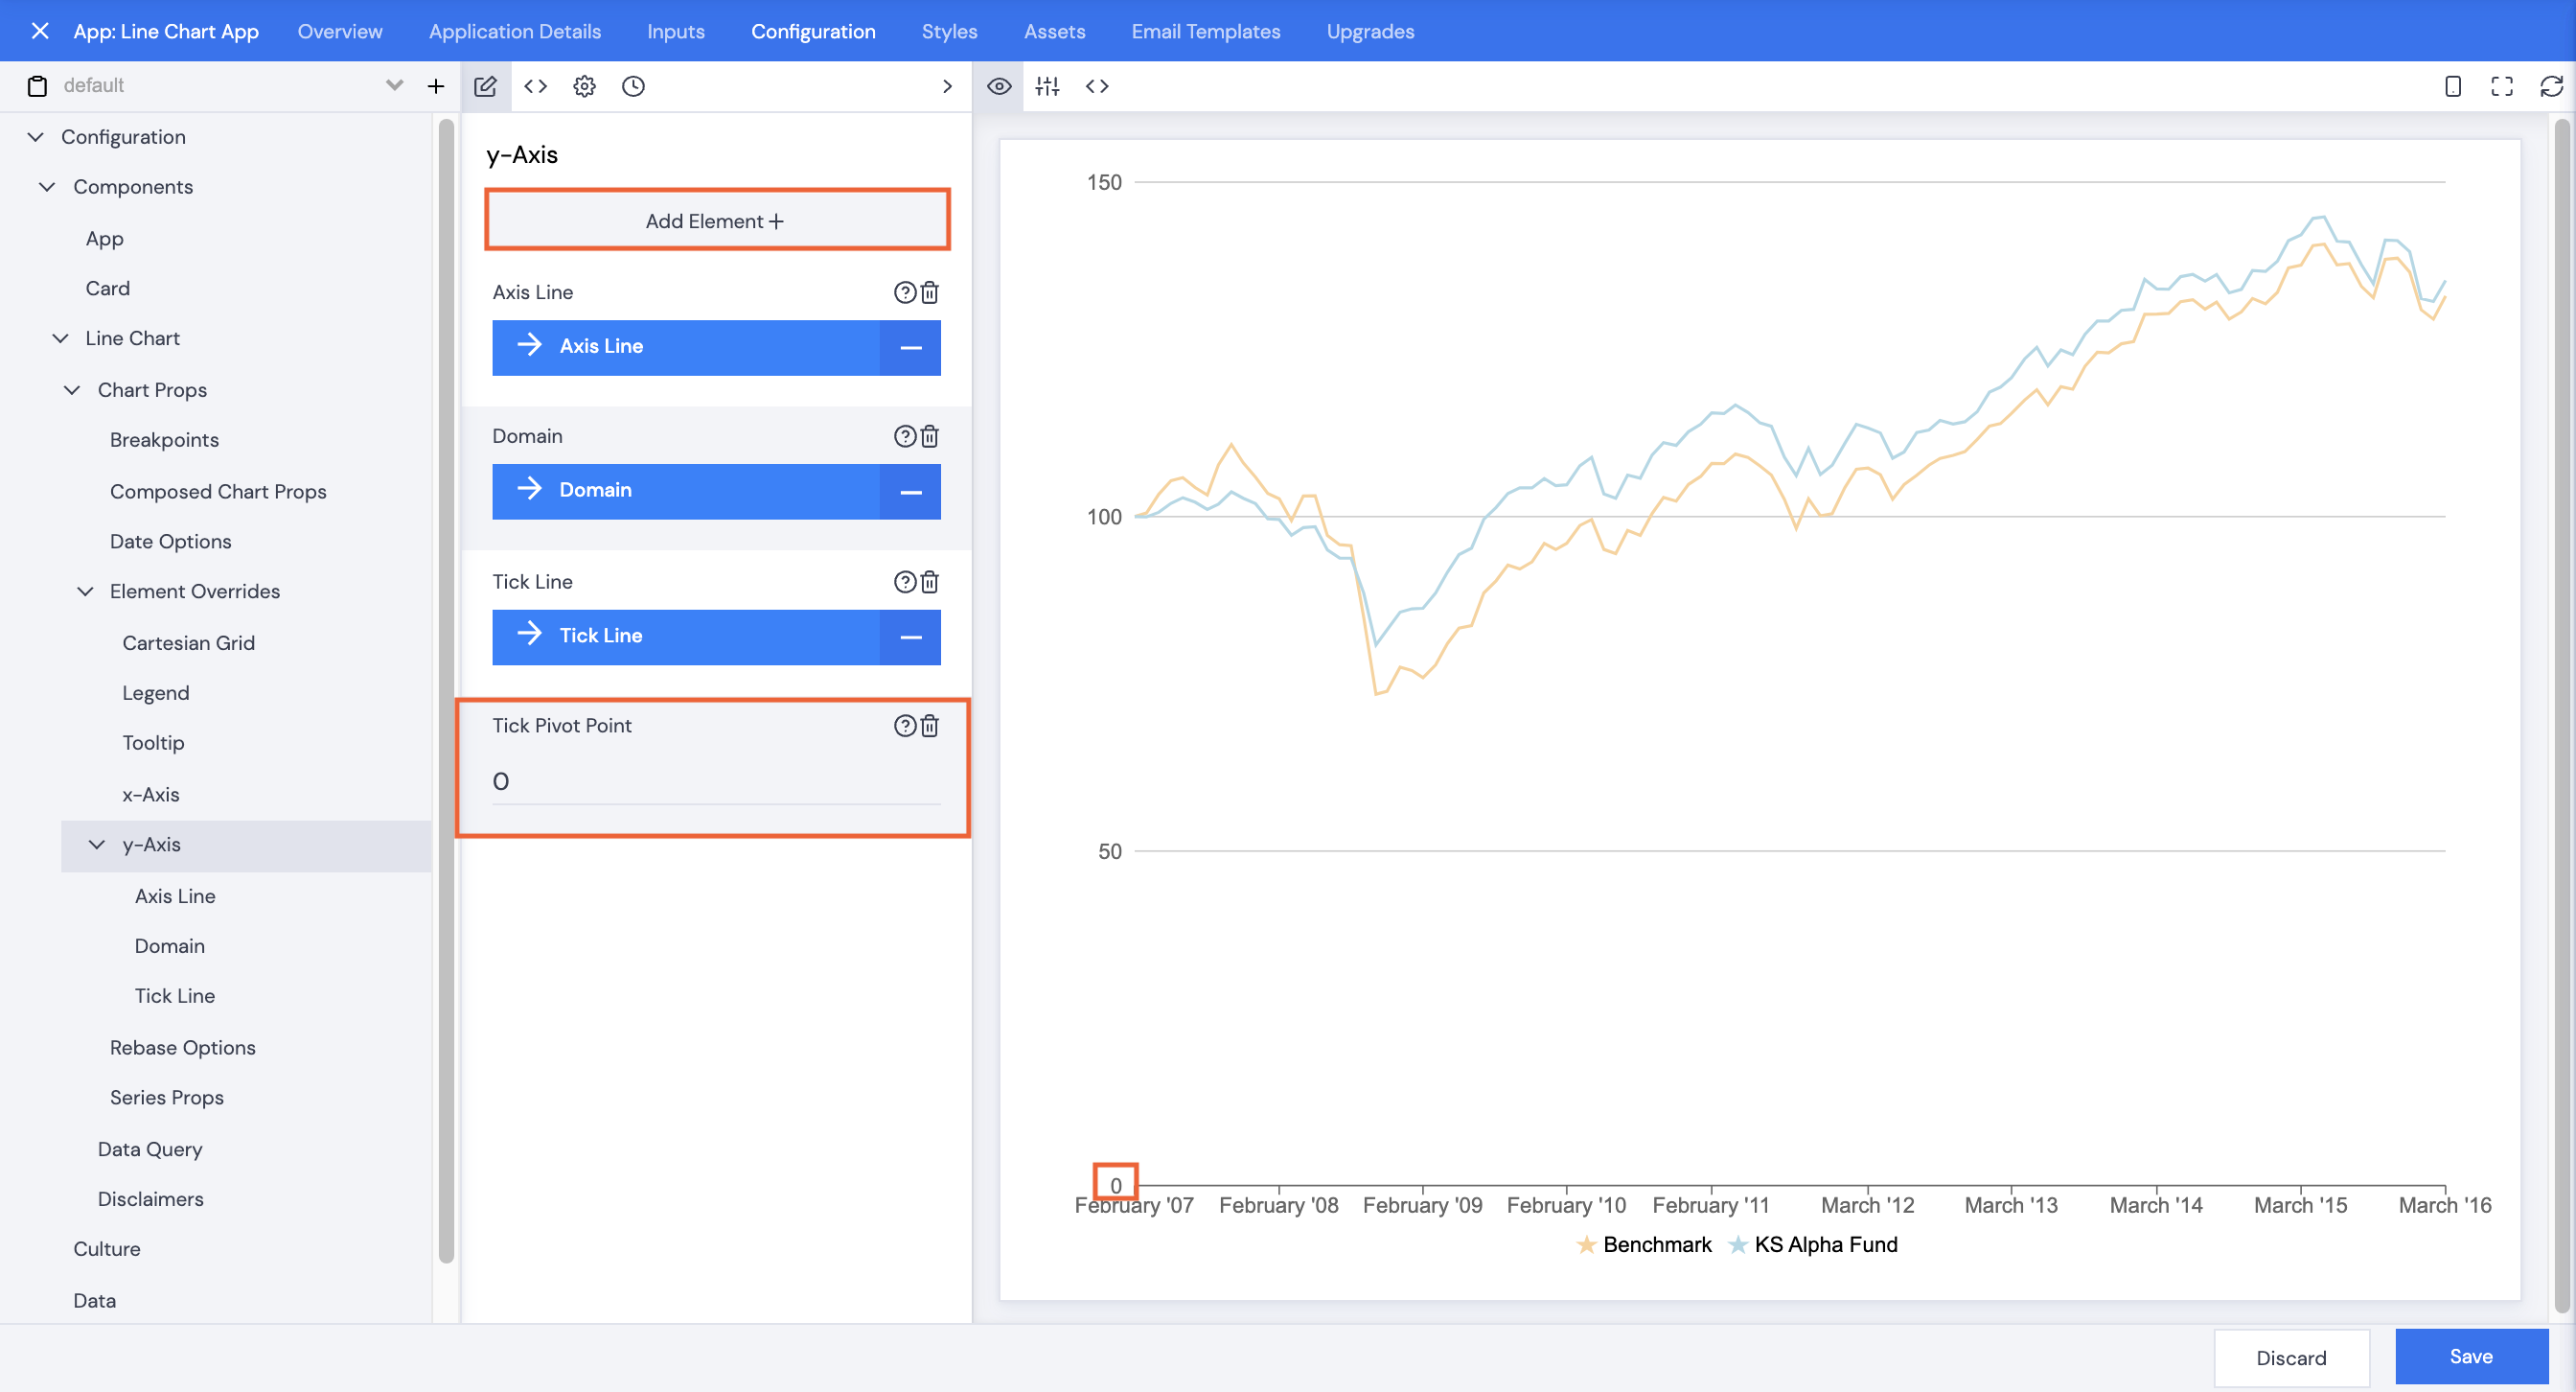
- Change the Tick Pivot Point value, e.g. to “0”. The y-Axis will now start at “0”.
- Click Add Element+.
- Scroll or search to select Tick Count, then click Save.
- Type in a value for the Tick Count to increase the number of ticks in the y-Axis, e.g. “8”.
- Click Save.
- Type in a comment, then click Confirm.