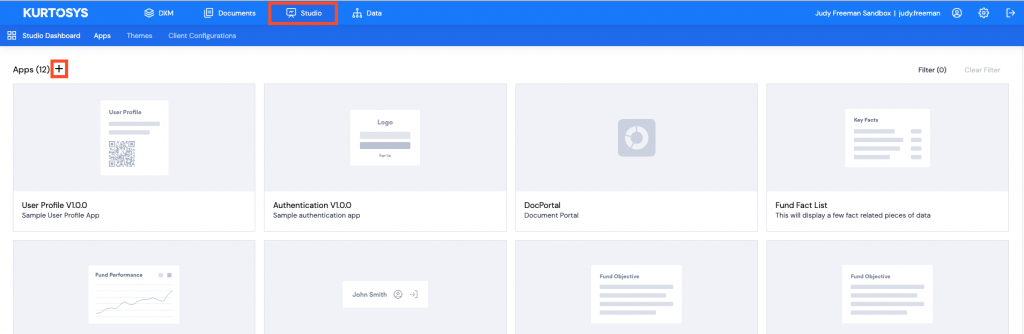
Categories

System Admin
DXM
Documents
Data

Links

Line Chart App

Table of Contents

Description

The Line Chart App is used for displaying timeseries data so that there is a clear indication of change over time. 

Add a new App

Click the Studio tab, then click + to add a new application.
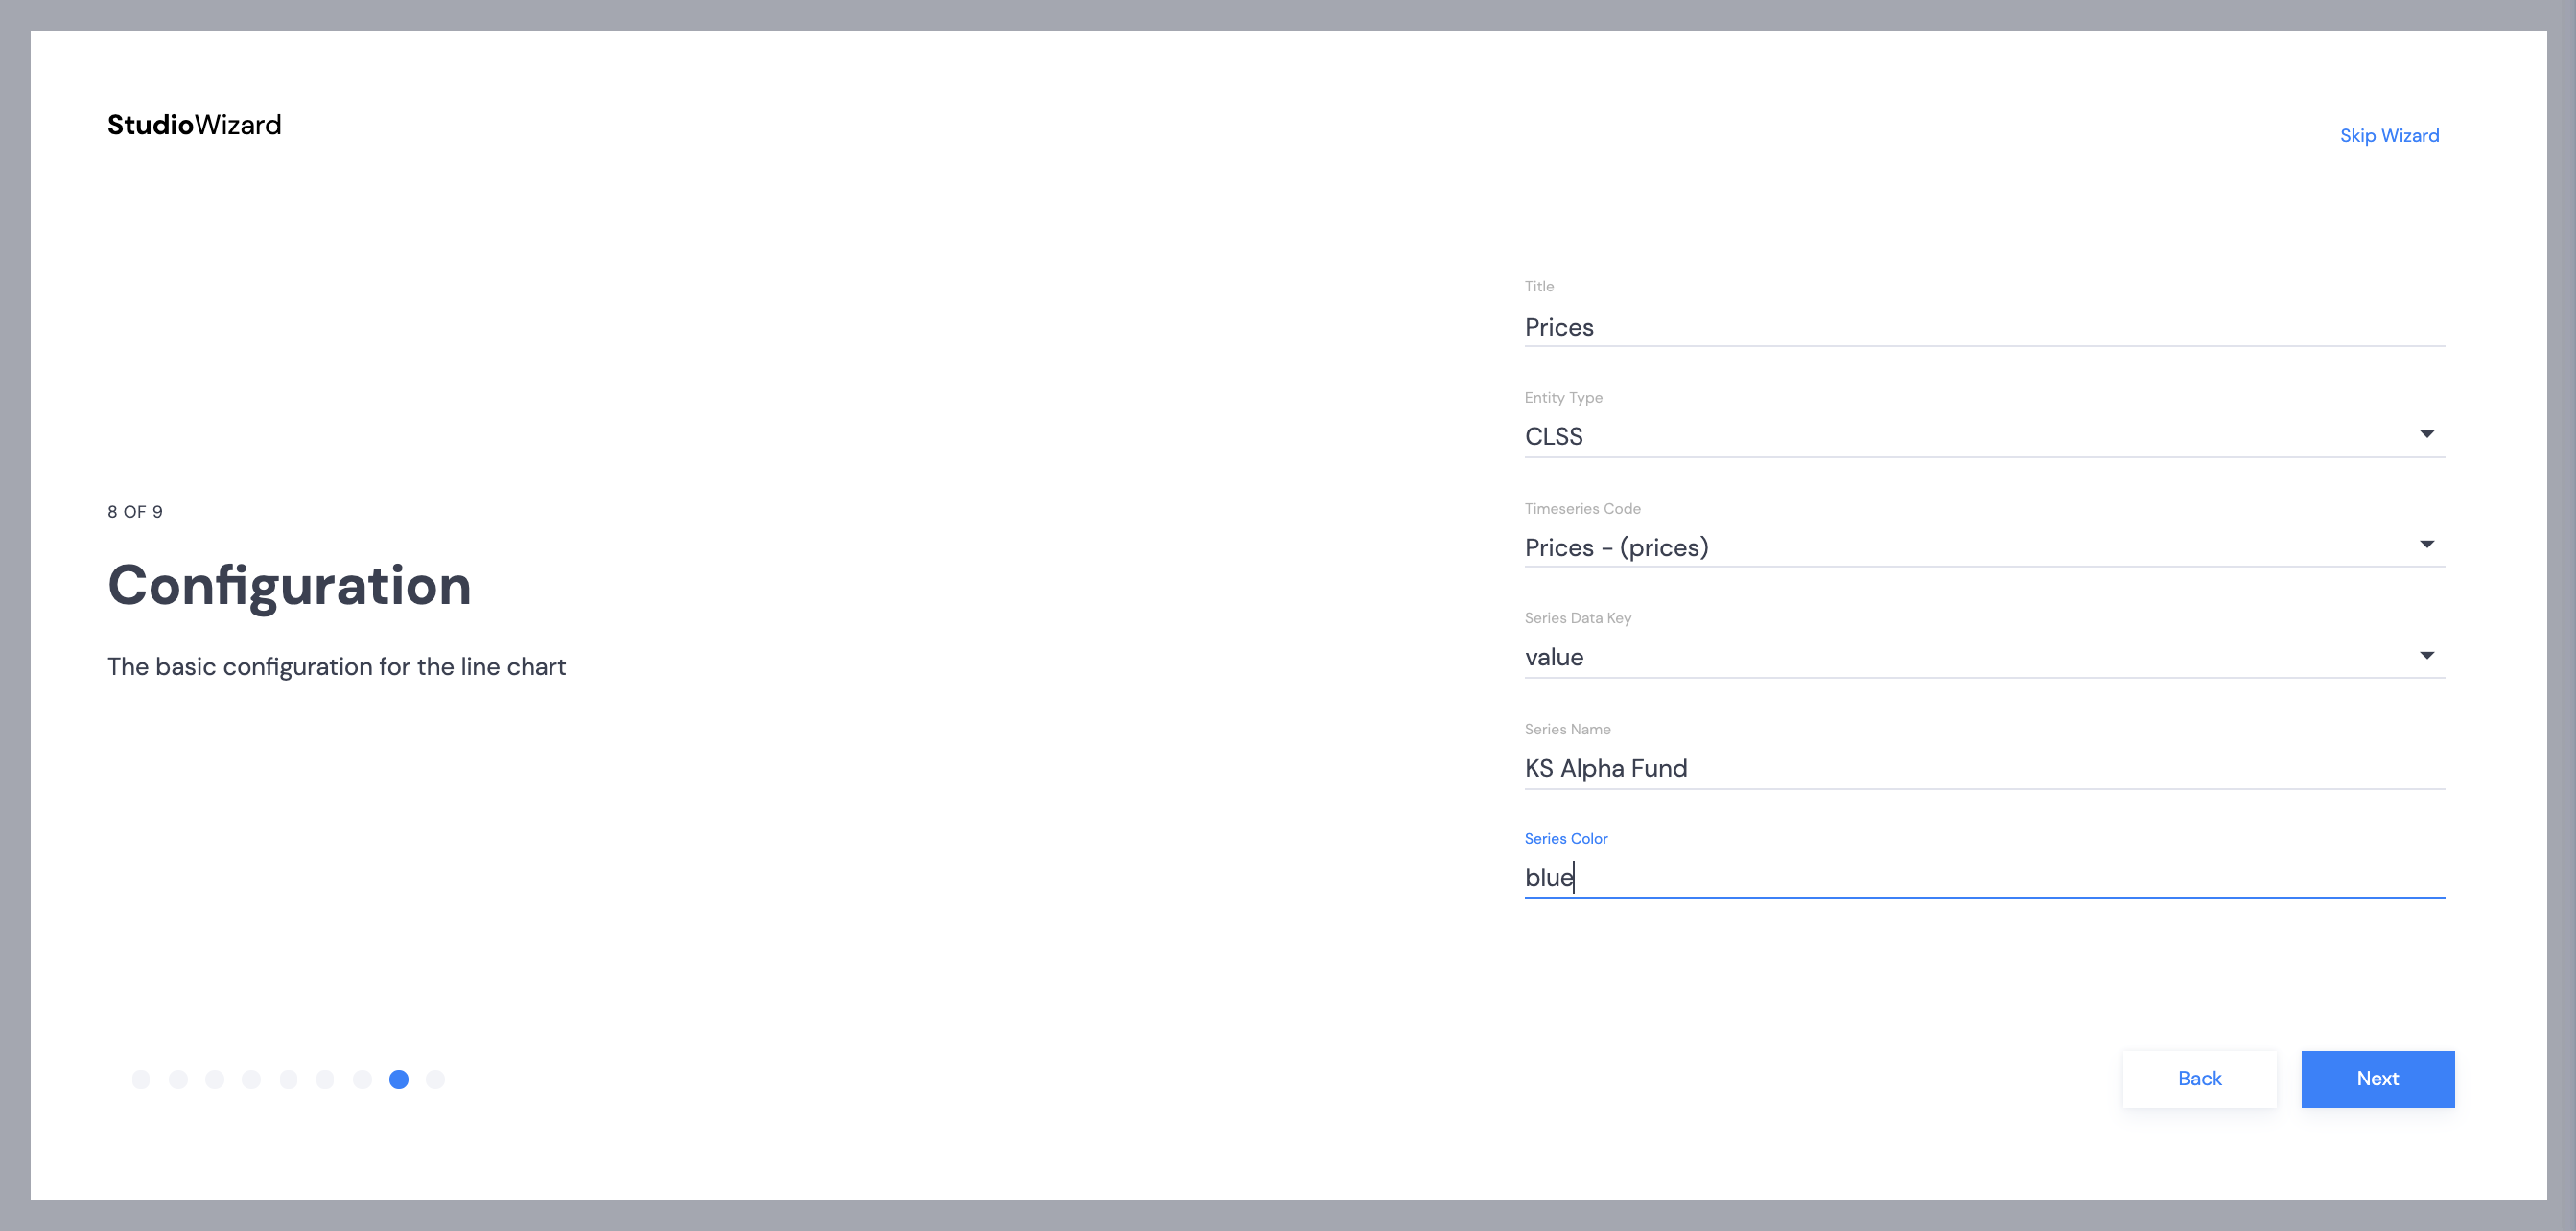
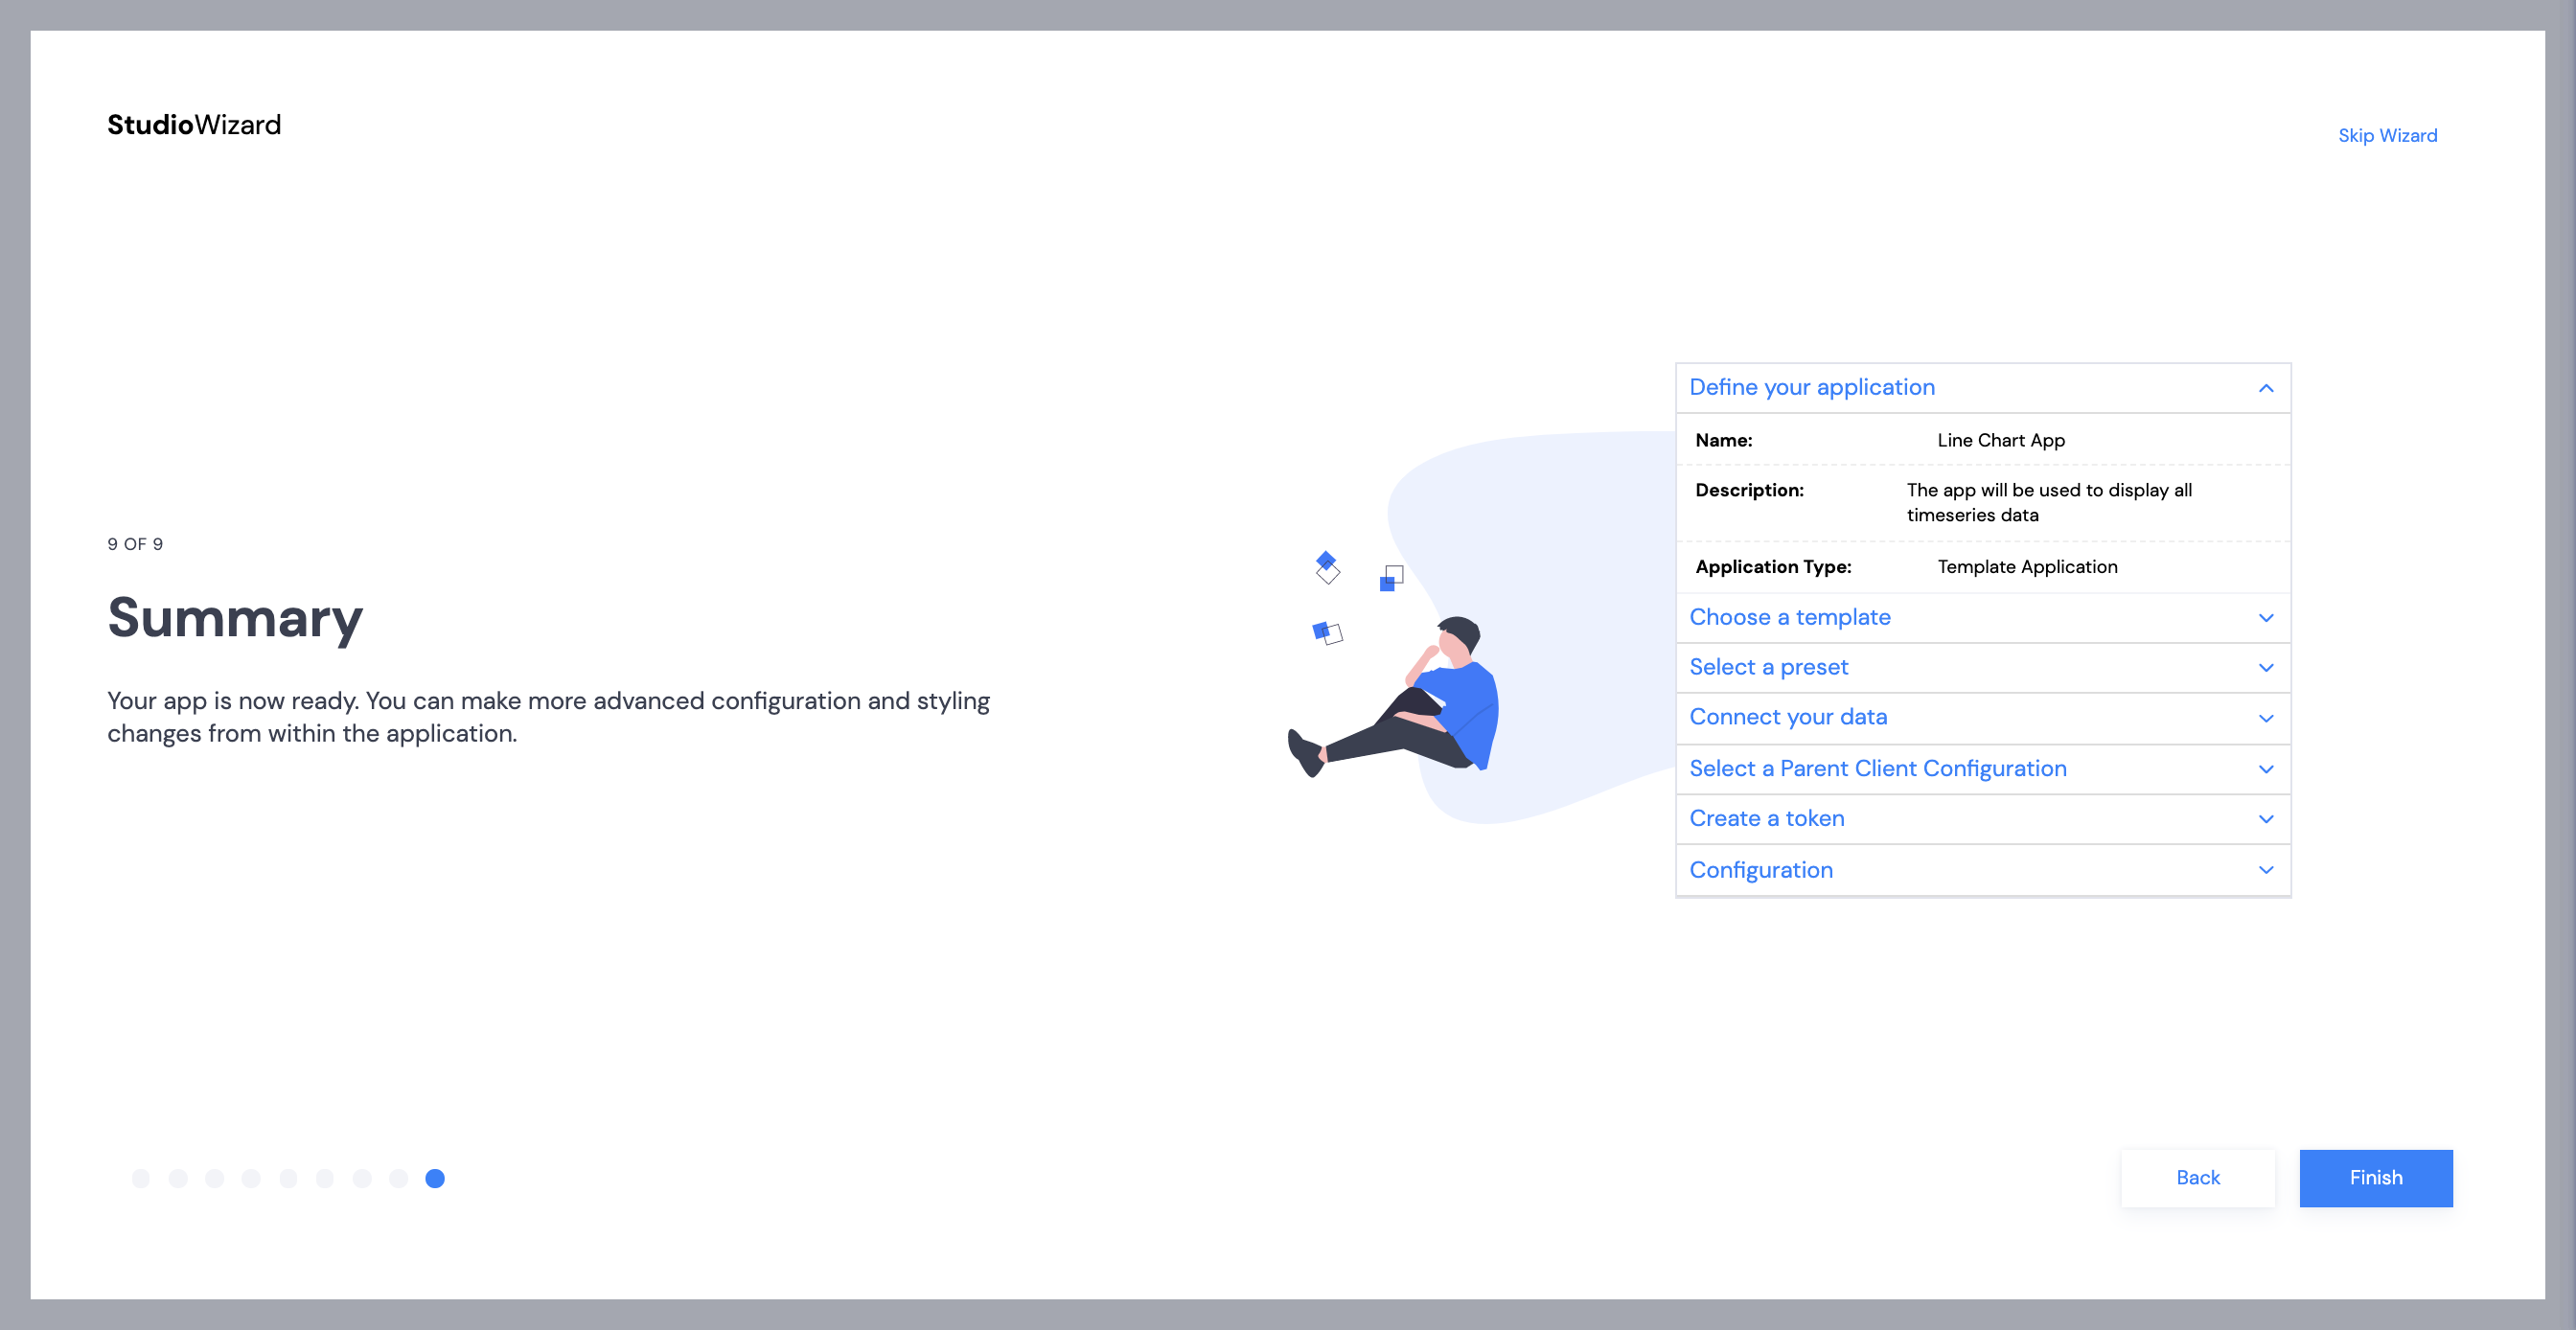
Studio Wizard

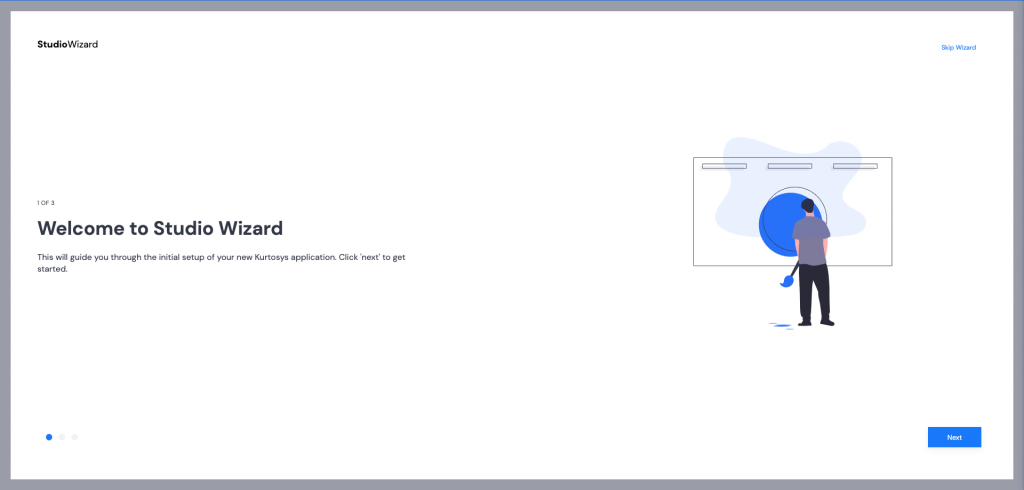
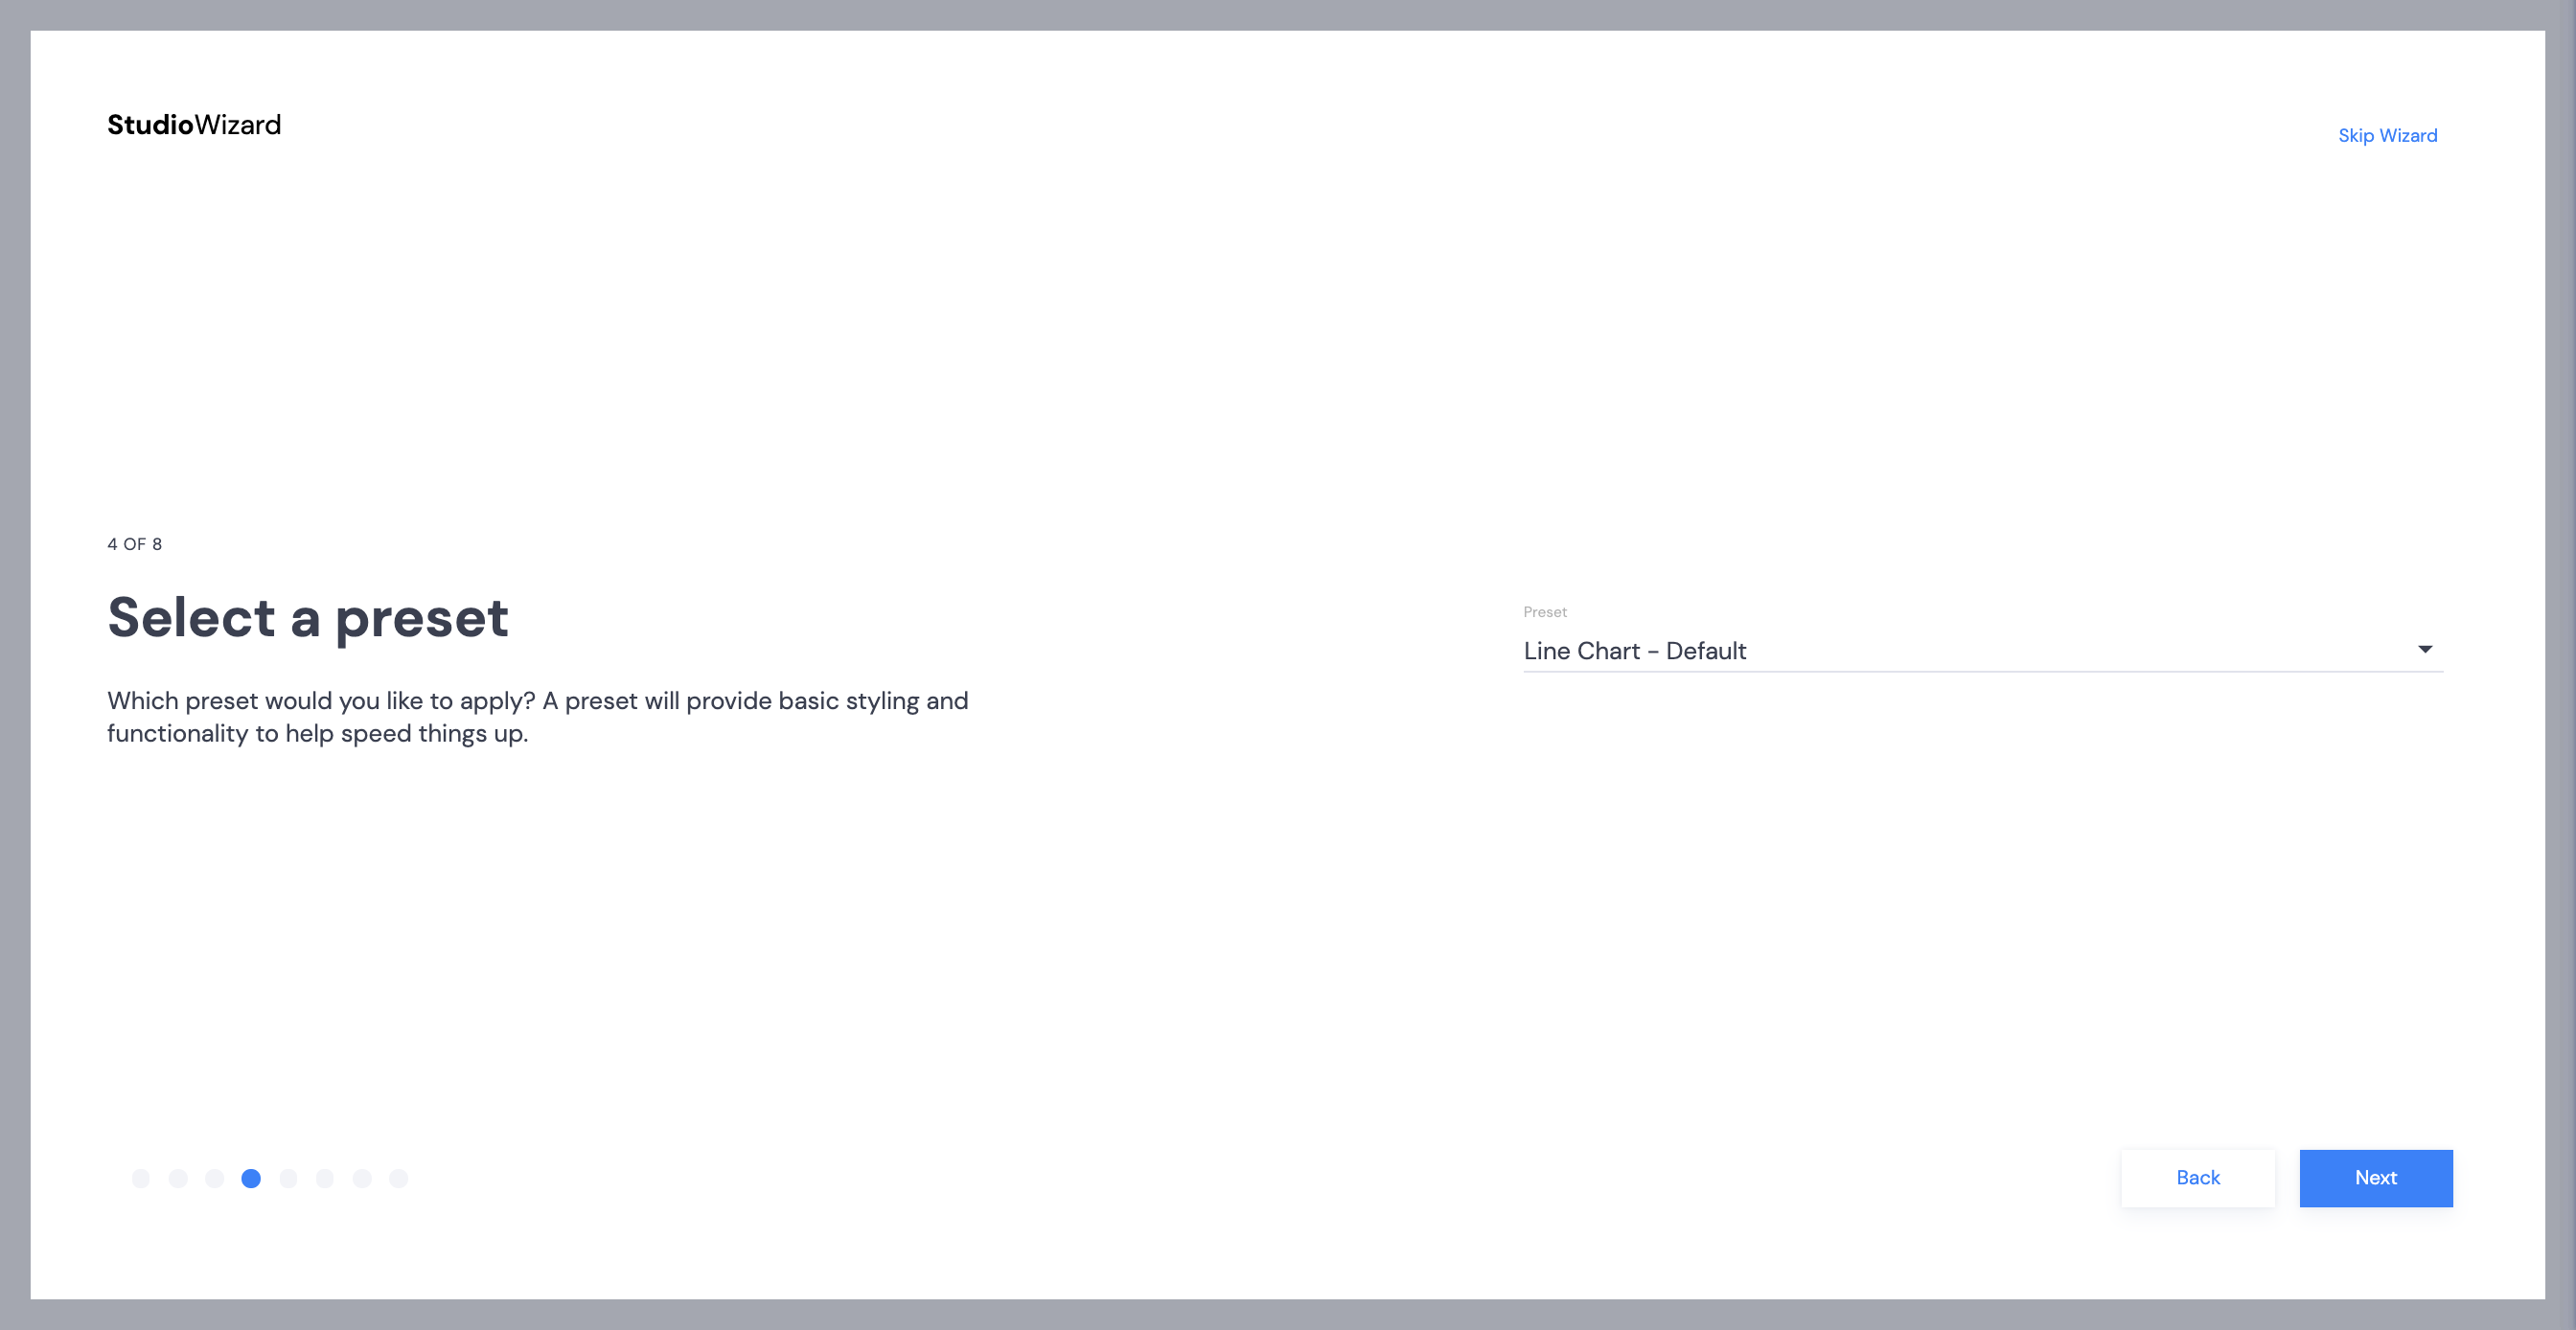
  1. Click Next to start the Studio Wizard.
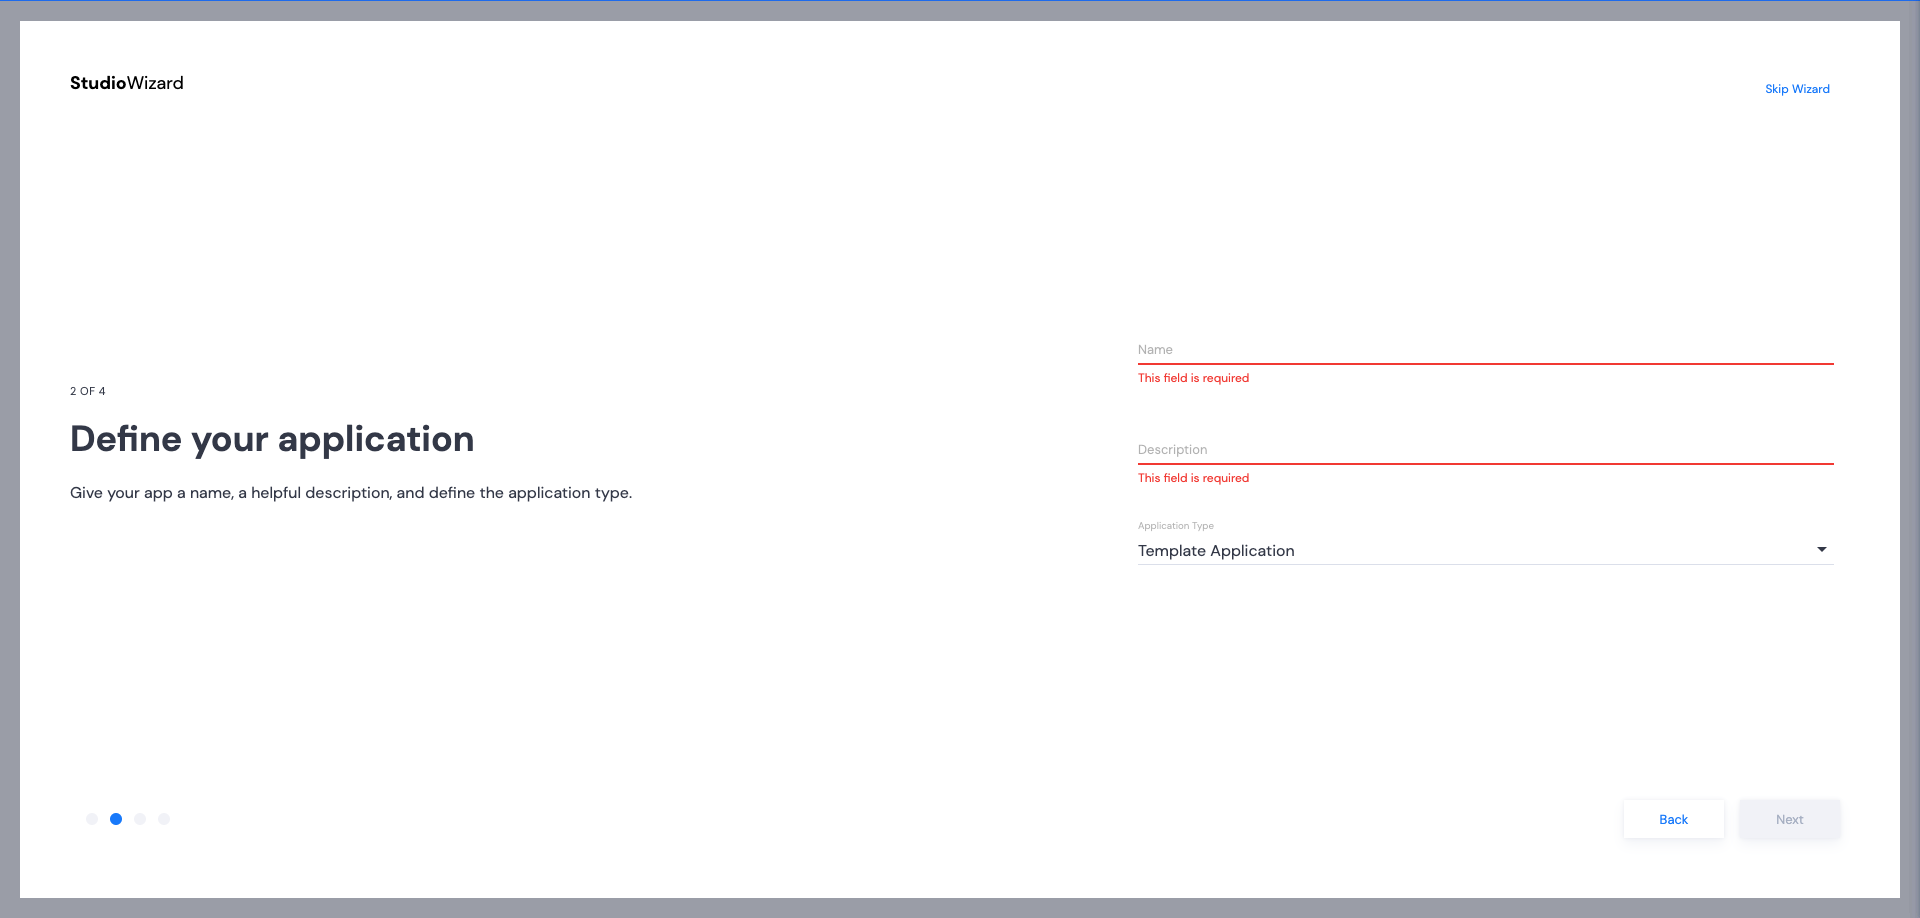
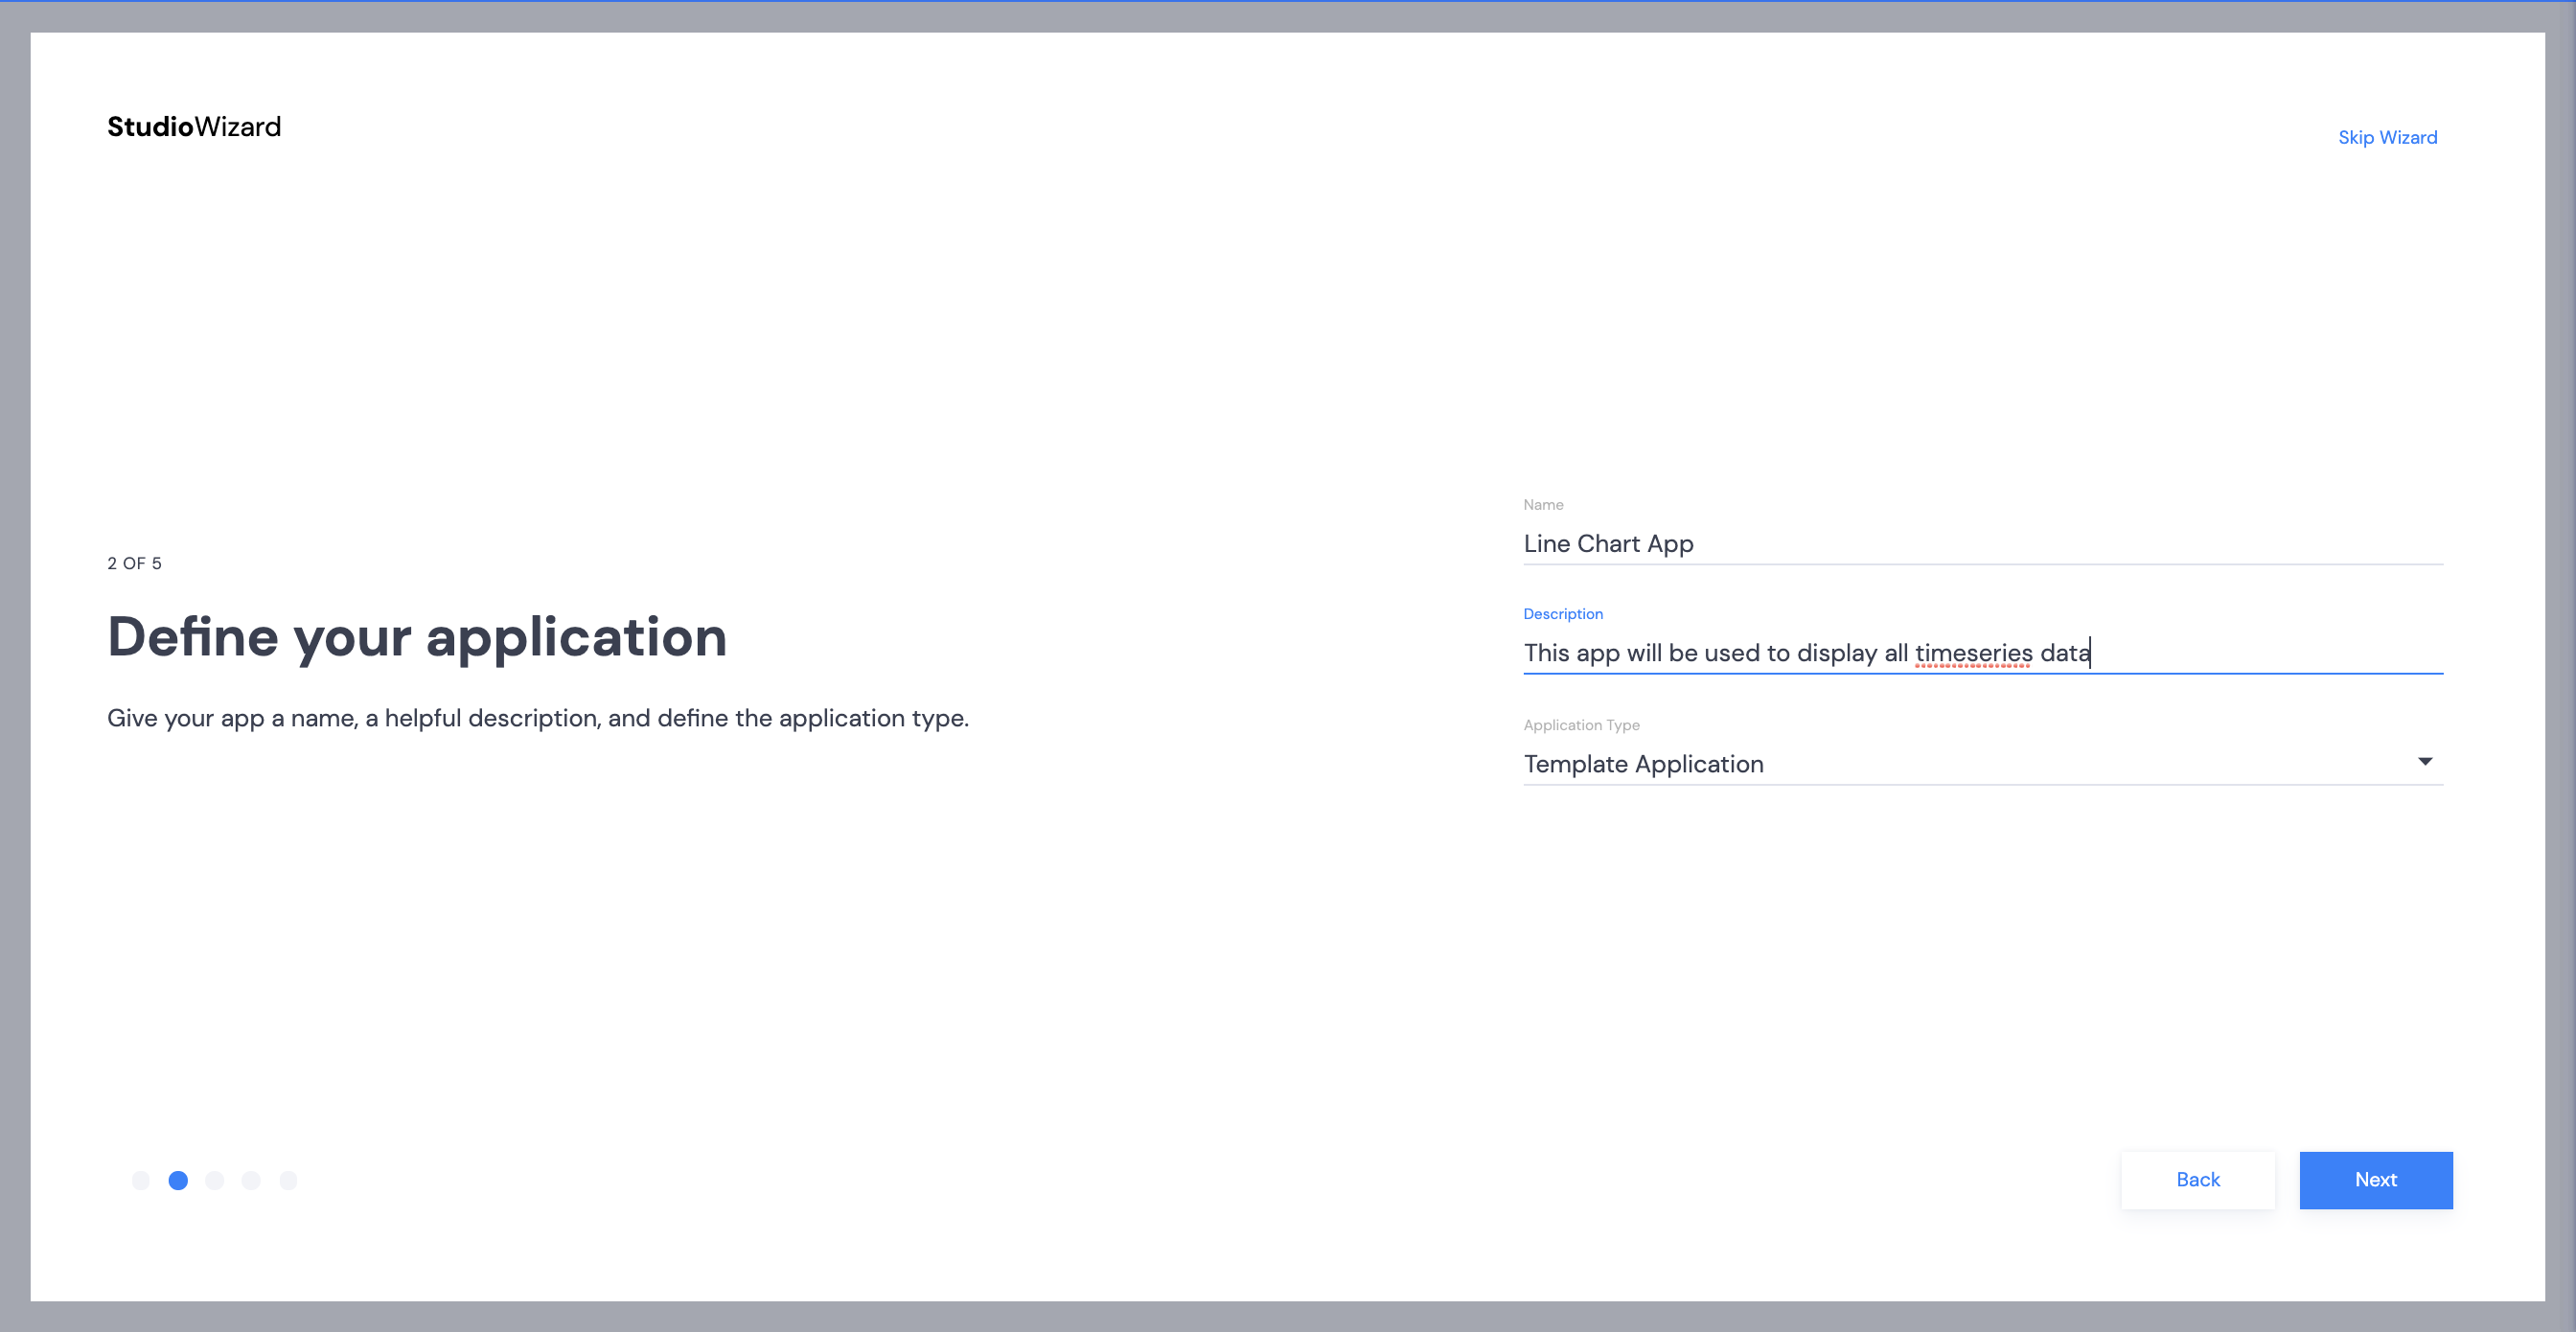
  2. Provide a name and description for your app. Once these items have been filled, the Next button will become active. Click Next.
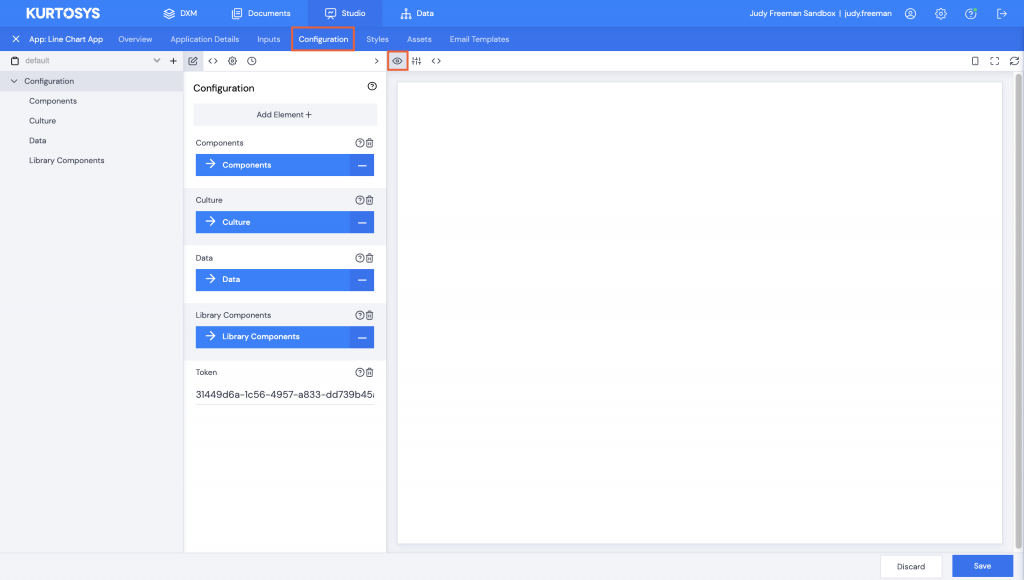
  1. Use the dropdown arrow to select a template to base your application on. Enter a few letters of the application name to make the search easier.
  2. Select Kurtosys App Line Chart 1.6.0 (or the latest version available), then click Next.
  1. Select a preset – only Line Chart – Default is available, then click Next.
  2. Connect your data – Line Charts need both a Culture input and a client code or entity type input.
  1. No Parent Client Configuration is required for this app, click Next.
  1. The token (each client instance has a unique identifier) will be added automatically, click Next.
  2. Configuration:
    • Title – the line chart will need a display title
    • Entity Type – select either CLSS, FUND, ACCT etc.
    • Timeseries Code – select the timeseries property that is reflected by the title
    • Series Data Key – refer to the Data | Timeseries table below for this value
    • Series Name – type in the fund’s name
    • Series Color – type in the name or hex code for a color
  1. Click Next.
  1. Click Finish.
Note: The X Axis Period Options will need to be edited (either in the UI or the JSON) to match your periodicity requirements.

Configuration

Copy and Paste  JSON

If you choose to skip the Wizard, you can build the app by copying and pasting a JSON config file such as the one below into your configuration editing screen.

Note: The periodOptions in the config file will need to be edited to match your periodicity requirements.
{
  "components": {
    "app": {},
    "card": {
      "props": {
        "title": {
          "value": "Prices"
        }
      }
    },
    "lineChart": {
      "chartProps": {
        "breakpoints": [
          {
            "modifier": "up",
            "props": {},
            "size": "medium"
          },
          {
            "modifier": "down",
            "props": {
              "dateOptions": {
                "xAxisDateAsNumber": true,
                "xAxisTickOptions": {
                  "periodOptions": [
                    {
                      "periodKey": "3M",
                      "tickCount": 2
                    },
                    {
                      "periodKey": "6M",
                      "tickCount": 2
                    },
                    {
                      "periodKey": "1Y",
                      "tickCount": 2
                    },
                    {
                      "periodKey": "2Y",
                      "tickCount": 2
                    },
                    {
                      "periodKey": "3Y",
                      "tickCount": 2
                    },
                    {
                      "periodKey": "5Y",
                      "tickCount": 2
                    },
                    {
                      "periodKey": "10Y",
                      "tickCount": 2
                    }
                  ],
                  "tickCount": 2
                }
              },
              "elementOverrides": {
                "xAxis": {
                  "dataKey": "date",
                  "domain": [
                    "dataMin",
                    "dataMax"
                  ],
                  "interval": "preserveStartEnd",
                  "tickFormatter": {
                    "options": {
                      "dateFormatString": "MMM 'YY"
                    },
                    "type": "date"
                  }
                }
              }
            },
            "size": "small"
          }
        ],
        "composedChartProps": {
          "height": 300,
          "margin": {
            "bottom": 20,
            "left": 20,
            "right": 40,
            "top": 20
          }
        },
        "dateOptions": {
          "xAxisDateAsNumber": true,
          "xAxisTickOptions": {
            "periodOptions": [
              {
                "periodKey": "3M",
                "tickCount": 3
              },
              {
                "periodKey": "6M",
                "tickCount": 6
              },
              {
                "periodKey": "1Y",
                "tickCount": 12
              },
              {
                "periodKey": "2Y",
                "tickCount": 12
              },
              {
                "periodKey": "3Y",
                "tickCount": 6
              },
              {
                "periodKey": "5Y",
                "tickCount": 5
              },
              {
                "periodKey": "10Y",
                "tickCount": 10
              }
            ],
            "tickCount": 5
          }
        },
        "elementOverrides": {
          "cartesianGrid": {
            "vertical": false
          },
          "legend": {
            "iconType": "square"
          },
          "tooltip": {
            "cursor": {
              "stroke": "#C7C7C7",
              "strokeWidth": "1"
            },
            "formatter": {
              "options": {
                "maximumFractionDigits": 3
              },
              "type": "number"
            },
            "hide": false,
            "labelFormatter": {
              "options": {
                "day": "2-digit",
                "month": "short",
                "year": "2-digit"
              },
              "type": "date"
            }
          },
          "xAxis": {
            "dataKey": "date",
            "domain": [
              "dataMin",
              "dataMax"
            ],
            "interval": "preserveStartEnd",
            "tickFormatter": {
              "options": {
                "dateFormatString": "MMMM 'YY"
              },
              "type": "date"
            }
          },
          "yAxis": {
            "axisLine": false,
            "domain": [
              "dataMin",
              "dataMax"
            ],
            "tickLine": false,
            "tickPivotPoint": 100
          }
        },
        "seriesProps": [
          {
            "dataKey": "value",
            "dot": false,
            "name": "KS Alpha Fund",
            "stroke": "blue",
            "strokeWidth": 3
          }
        ]
      },
      "data": {
        "code": "prices",
        "entityType": "CLSS",
        "placeholder": "-",
        "queryOptionsType": "timeseries"
      },
      "disclaimers": [
        {
          "key": "Past Perf",
          "queryOptionsType": "disclaimers"
        },
        {
          "key": "performance_disclaimer",
          "queryOptionsType": "disclaimers"
        }
      ]
    }
  },
  "culture": {
    "base": "en-GB",
    "default": "en-GB"
  },
  "data": {
    "context": {
      "entityByType": {
        "CLSS": {
          "clientCodeProperty": "isin",
          "include": {
            "statistics": {},
            "timeseries": {}
          },
          "inputKey": "isin",
          "searchEntityRequest": {
            "applyFormats": true
          }
        },
        "FUND": {
          "clientCodeProperty": "isin",
          "include": {
            "statistics": {},
            "timeseries": {}
          },
          "inputKey": "isin",
          "searchEntityRequest": {
            "type": "CLSS"
          }
        }
      },
      "globalDisclaimers": [
        {
          "global": true
        }
      ]
    }
  },
  "libraryComponents": {
    "global": {
      "formats": {
        "percent": {
          "options": {
            "maximumFractionDigits": 2,
            "minimumFractionDigits": 2
          },
          "transforms": [
            {
              "operator": "divide",
              "value": 100
            }
          ],
          "type": "percent"
        }
      }
    }
  },
  "token": "USE YOUR OWN TOKEN HERE "
}    
    

Preview

Click Configuration then the Preview icon.

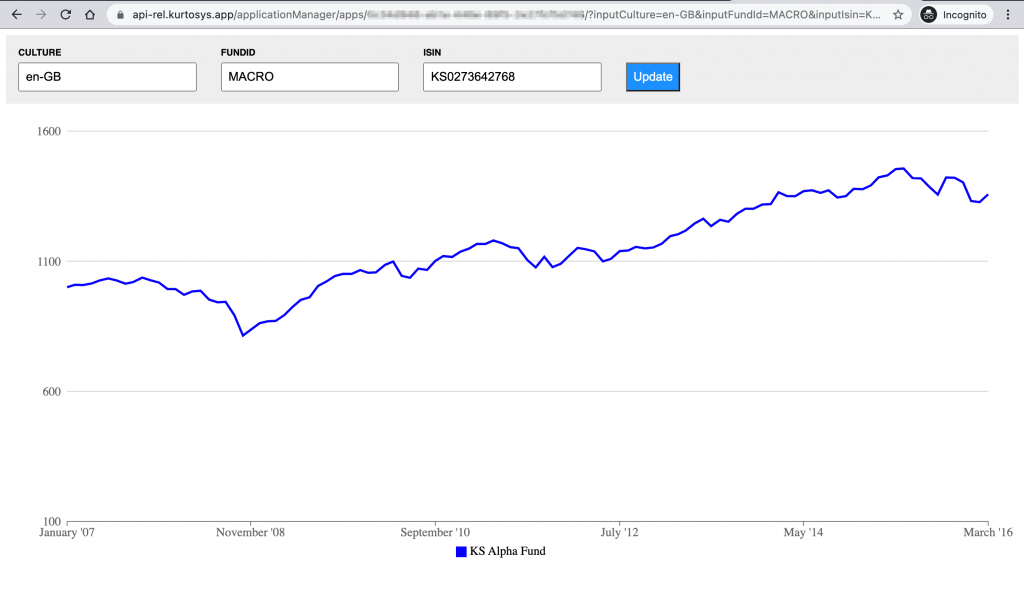
Should your app preview not work, depending on where your client organization is hosted, you can test it using:

https: // api-uk.kurtosys.app/applicationManager/apps/your-app-guid-here/

or 

https: // api-us.kurtosys.app/applicationManager/apps/your-app-guid-here/

or

https: // api-eu.kurtosys.app/applicationManager/apps/your-app-guid-here/


You can find your app guid by clicking the Application Details tab.

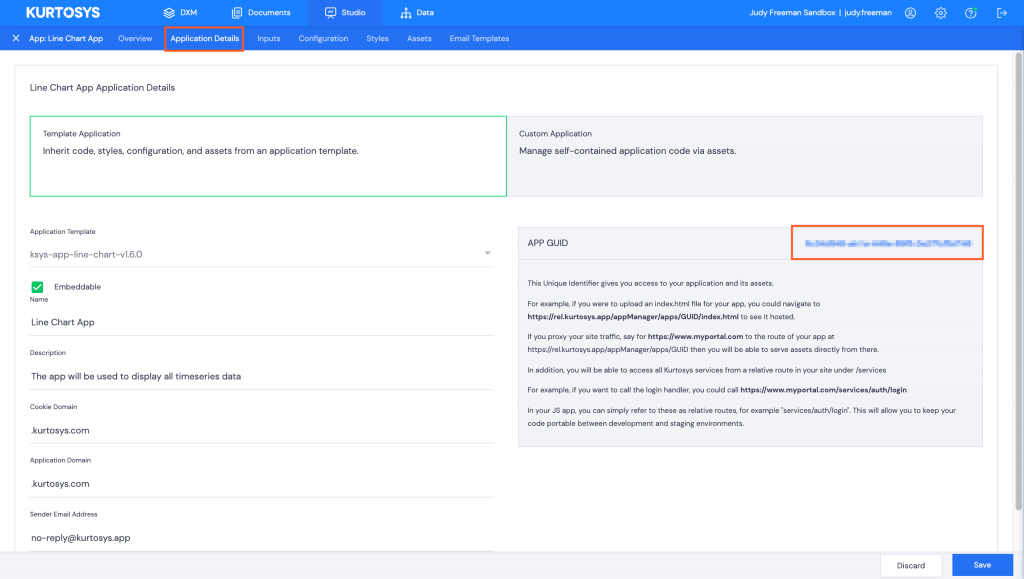
This will allow you to see your app online as in the screenshot below.

If your app works in the URL, ensure that your inputKey is set to clientCode to see the Studio Preview.

Browse to Data | Context, click the <> JSON button then click the > right arrow to open the screen fully.

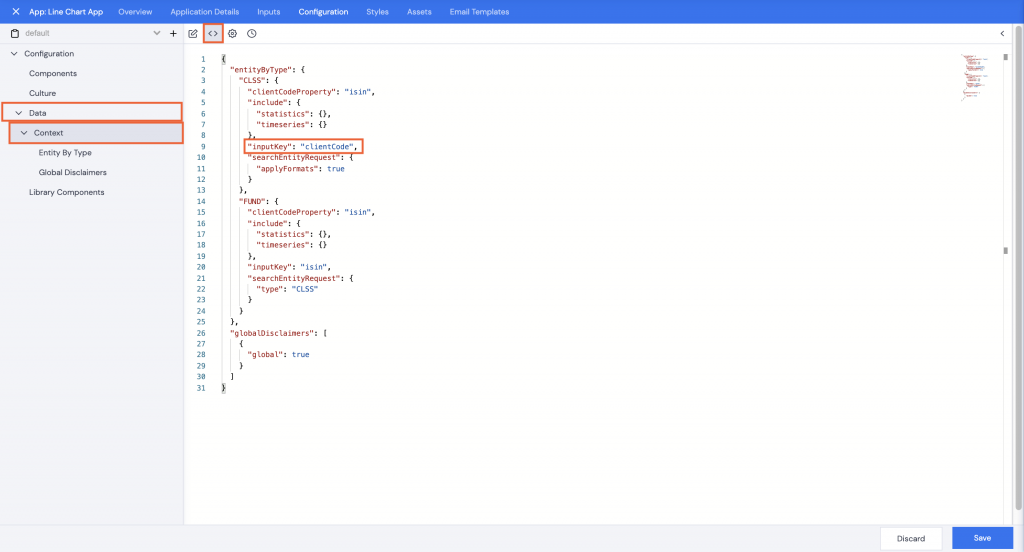
Change “inputKey”: “isin” to “inputKey”: “clientCode”.
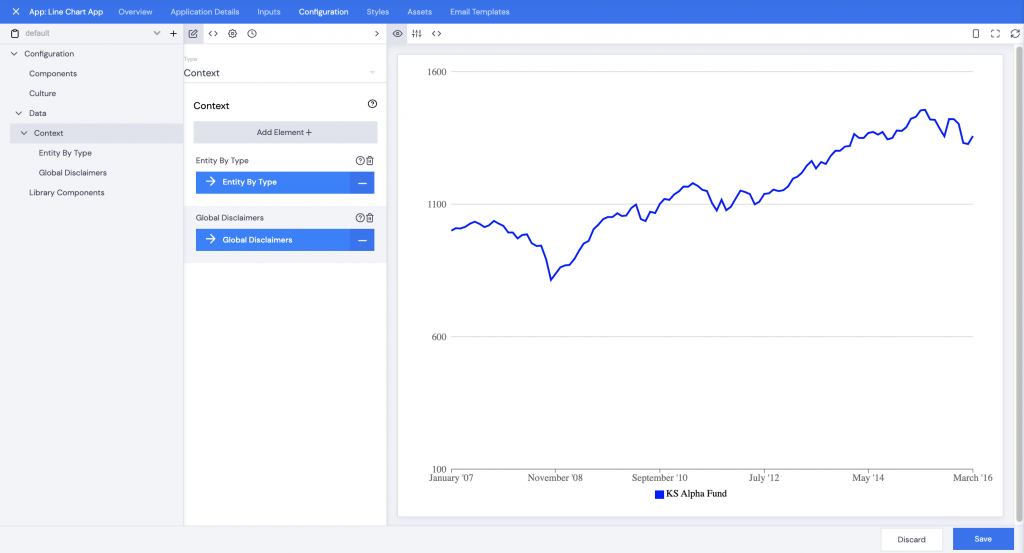
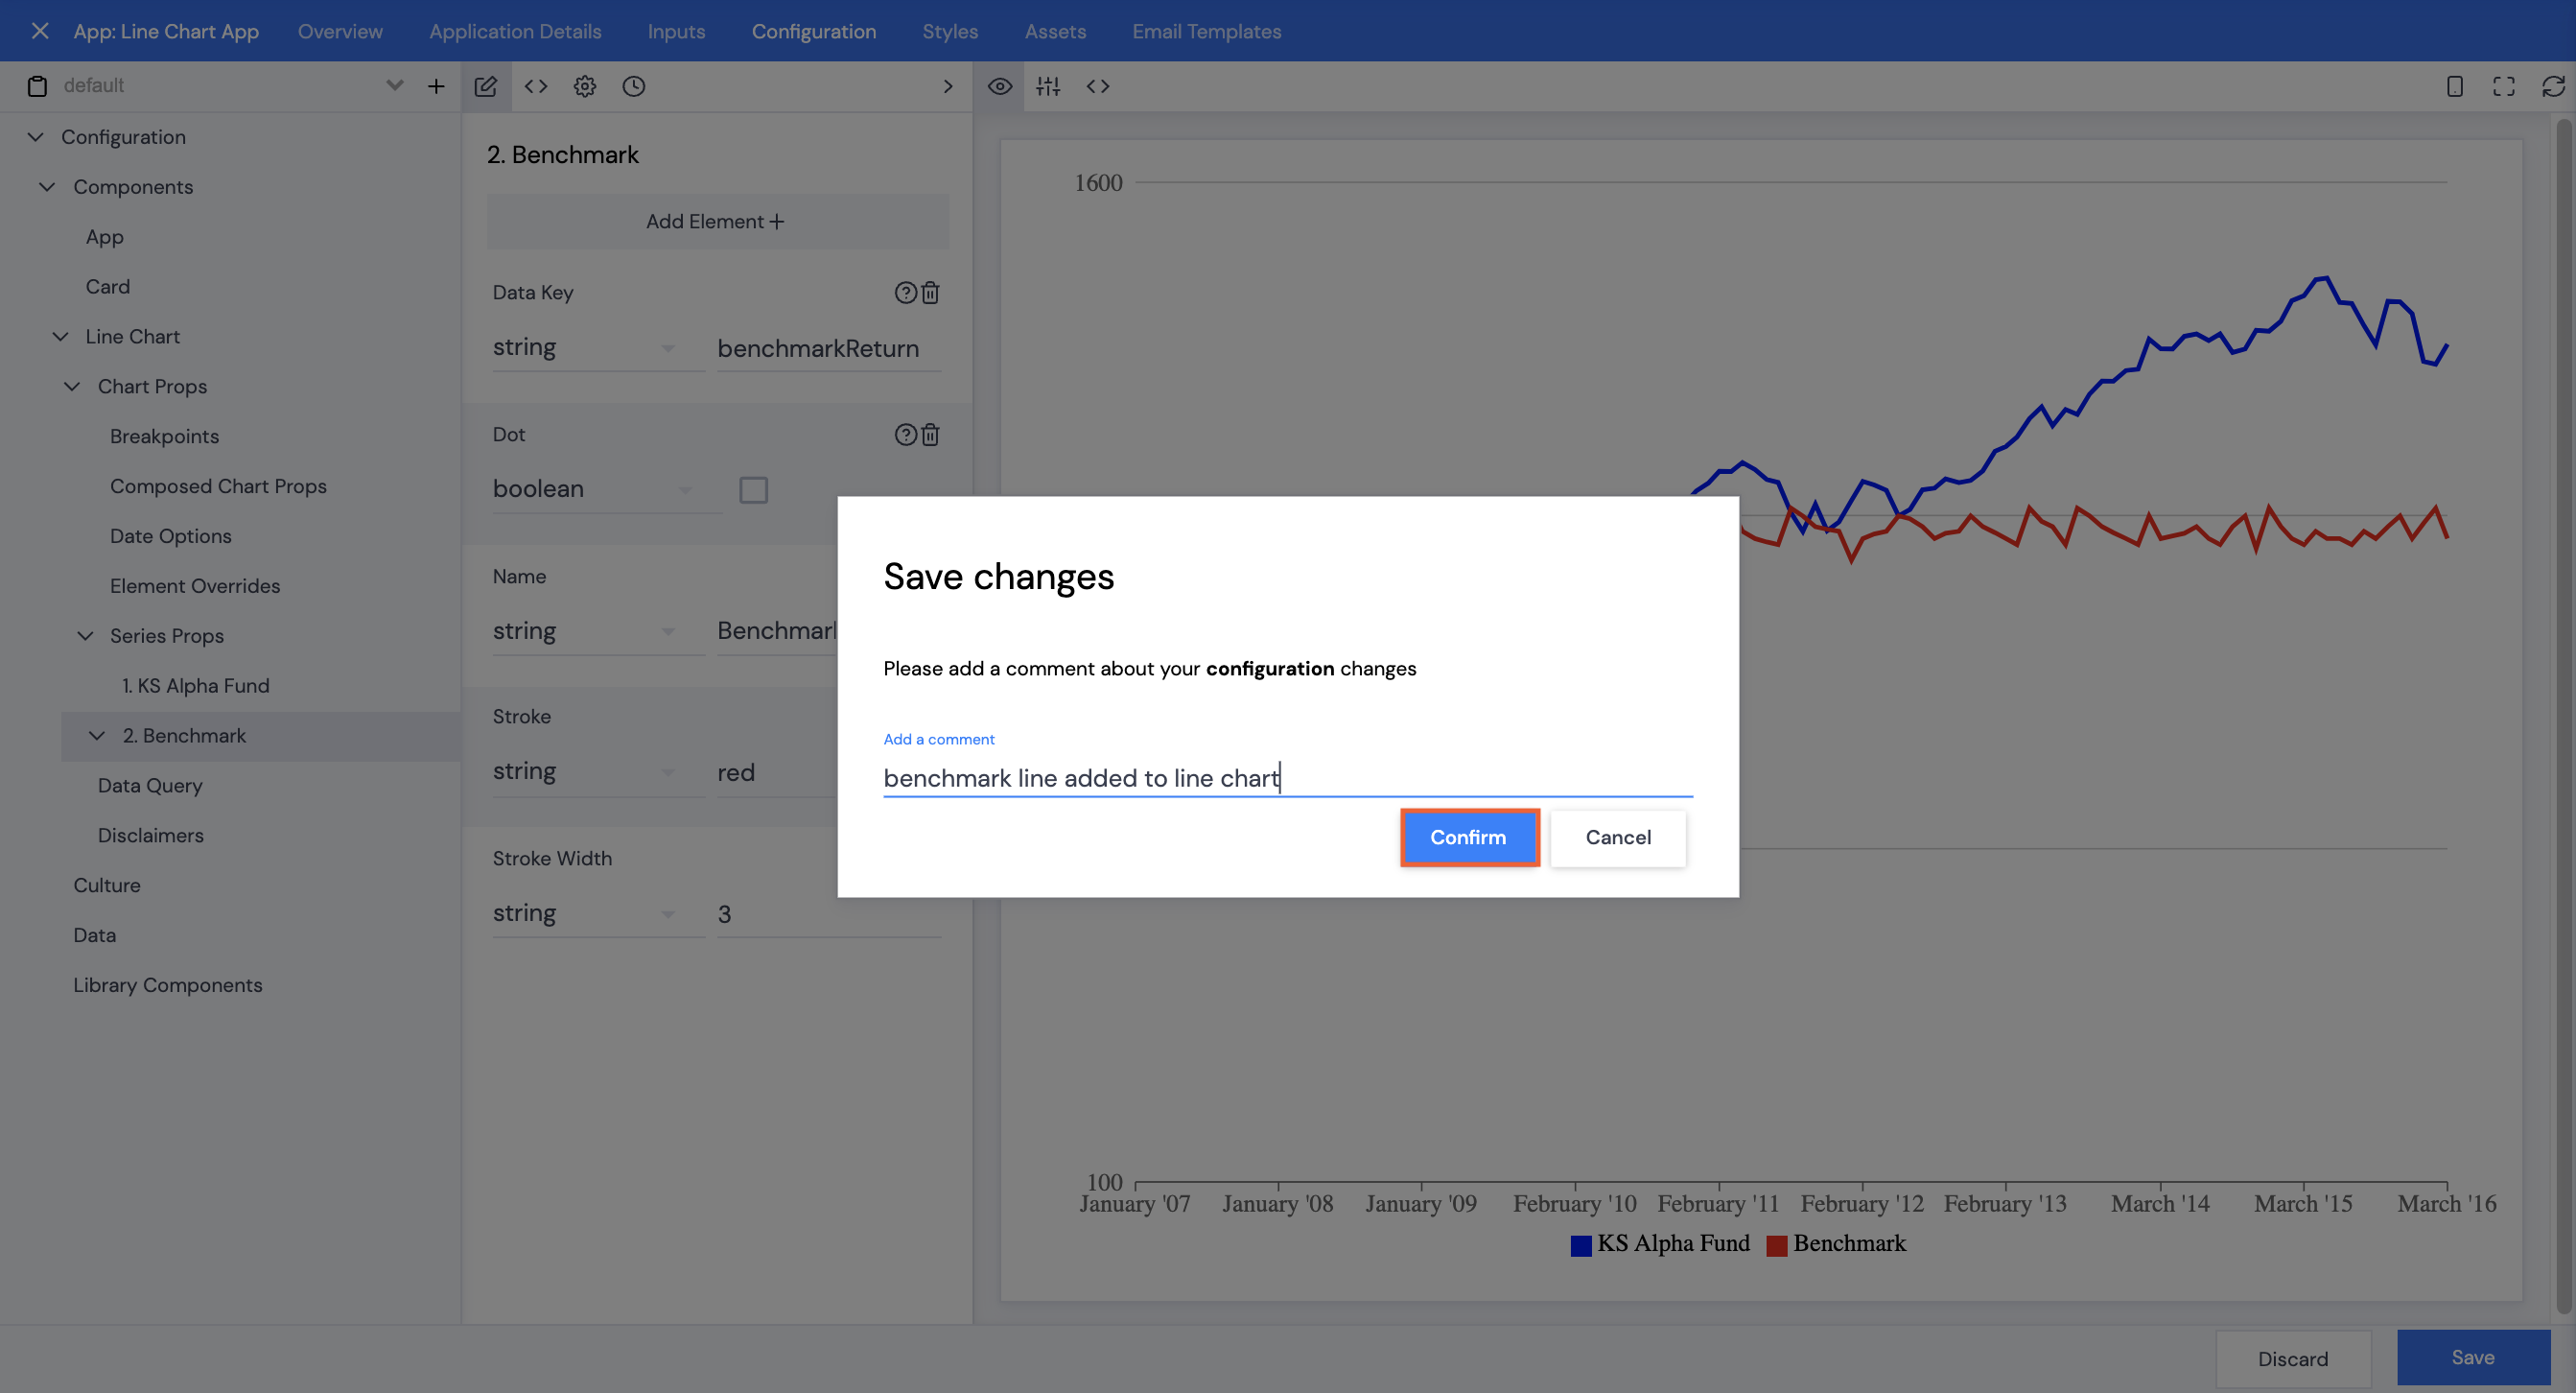
Click Save.

Type in a comment, e.g. inputKey changed to clientCode, then click Confirm.

Your Preview should now display correctly.

Customization

Update the Tick Count

  1. With the Configuration tab selected, browse to Components | Line Chart | Chart Props | Date Options then click xAxis Tick Options.
  2. Update the number under Tick Count for the number of ticks you would like to see on the X Axis, bearing in mind that the first tick is always at 0 (or the Y Axis), so, for example, setting this number to 9 would mean 10 ticks (as it includes the tick at 0 – the Y Axis).
Note: The calculation of the dates displayed in the X Axis is based on how many rows you have in your data table evenly distributed.
  1. Click Save.
  2. Type in a comment, then click Confirm.

Adding Comparative Funds

You may want to compare the Fund selected for the Line Chart with a benchmark or other fund.

Note: For the purposes of this example, an extended property has been added to the Prices table to reflect benchmark values as in the screenshot below.

With the configuration tab open:

  1. Browse to Components | Line Chart | Chart Props then click Series Props.
  1. The fund added via the Wizard will be displayed; click Add Row+.
  2. Click 2.No Label.
  1. Click Add Element+. The elements added here will specify where the data for the comparative fund is coming from, the color to use in the line chart, etc. E.g. Benchmark.
  2. Scroll or use the search field to select Data Key, DotName, Stroke, and Stroke Width.
  3. Click Save.
  1. Complete the selected elements, e.g.:
    • Data Key: type in the column name from the Timeseries table
    • Dot: set to boolean (leave it unchecked if you do not want a dotted line)
    • Name: type in the name for the additional fund, e.g. Benchmark
    • Stroke: type in the name or hex code for a color
    • Stroke width: type in a number for the thickness of the line
  1. Click Save.
  2. Type in a comment, then click Confirm.
Note: If your benchmark line is "on top" of your fund line, you can switch the order.
  1. Browse to the Series Props section.
  2. Click either the up or down arrow to switch the Benchmark to the first series and the fund to the second series.
  3. Click Save, then type in a comment and click Confirm.

Line Charts can have styling and rebasing applied.